Introduction
How long does it take you to run a “Monograph 3” geostatistical reserves analysis? Chances are that you find it complex, onerous and time consuming. If that’s the case, then you’re probably not using the right tools.
In this blog I’m going to describe how I used GIS to run 10 iterations of the Monograph 3 workflow and produce a final result, all in less than 1 hour. Seriously.

What is a “Monograph 3 geostatistical reserves analysis”
Good question. It is a methodology developed by the Society of Petroleum Evaluation Engineers (SPEE) used to estimate what proved area of a resource play (like Shale Oil or Gas) a company can book with their reserves regulator, e.g. the U.S. Securities and Exchange Commission (SEC).
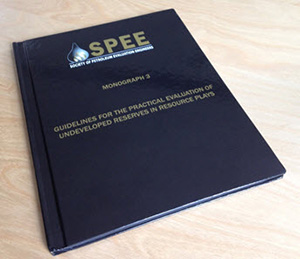
It was published as a hardback known as “Monograph 3” which is sub-titled “Guidelines for the Practical Evaluation of Undeveloped Reserves in Resource Plays”.
Why is the Monograph 3 reserves workflow important?
It is important because the SEC recommends that companies book reserves following the guidelines of the Petroleum Resources Management System (PRMS), which in turn recommends the use of SPEE’s Monograph 3.
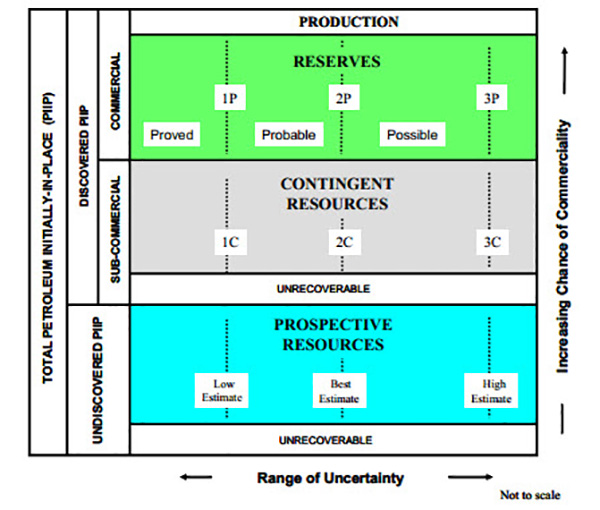
Not operating in the U.S.? Most other national reserves regulators follow the SEC, so the same situation applies.
If your company works in relatively mature unconventionals plays and needs to book reserves with a regulator, the chances are that its reserves evaluators are running some kind of geostatistical reserves analyses based on the guidelines in Monograph 3.
Basic “Monograph 3” workflow
Running the basic workflow doesn’t require much data – well name, well locations, some measure of well production, e.g. EUR (estimated ultimate recovery) or IP (initial production) and an area that defines the extent of what is considered to be the analogous area.
The basic workflow is summarised in the schematic and described in more detail below:
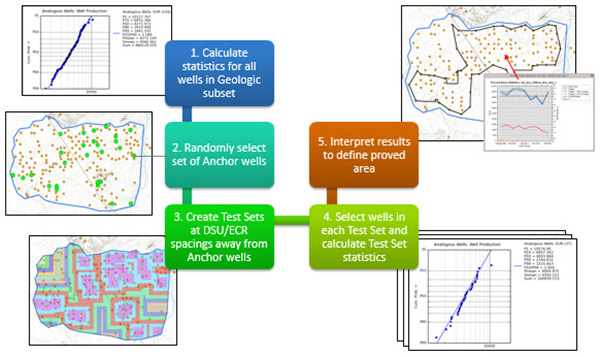
1. First up, plot a lognormal distribution of the well production data and calculate the following statistics for all the wells inside the analogous area:
- P10/P90 ratio
- P50
- Pmean
- P^ = (P50 + Pmean)/2
2. Randomly select a set of “anchor wells”, the size of which is guided by a table in Monograph 3 based on the P10/P90 ratio calculated above.
3. Fill the analogous area with concentric buffers, either DSU (drill space unit) or circular/elliptical, built from the anchor wells using a distance appropriate for your resource play, e.g. 1 or 2 DSU widths.
4. Select the wells in each buffer zone – these are called the “test sets”. Next, calculate the same statistics as in Step 1 for the set of anchor wells and each test set.
5. Plot the analogous wells, anchor wells and test set statistics on a graph to see whether test set statistics remain consistent as you step further away from the anchor wells. Create an “inward looking polygon” by joining from well to well in the analogous test set furthest away from the anchor wells to define the final proved area.
Multiple iterations
Once you’ve completed a single run of the basic Monograph 3 workflow you need to repeat this multiple times and overlay the results to find the common overlapping areas.
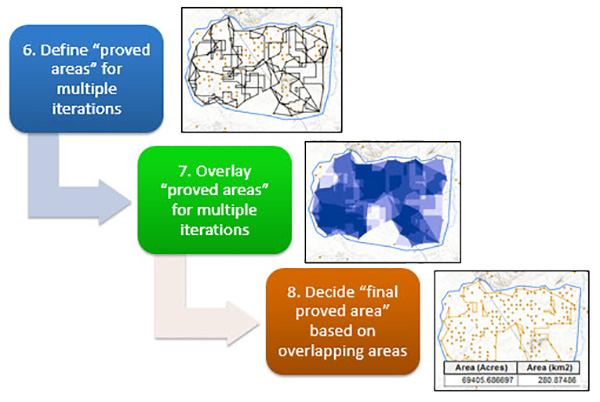
Monograph 3 says to run five iterations and look for areas with two or more overlaps, but this is open to interpretation depending on the confidence required.
1-hour Monograph 3
As you can see, this is a fairly complicated workflow, requiring both statistical and spatial analysis – it’s no surprise that it can take some reserve evaluators several weeks to complete.
But fear not – GIS is great at solving problems involving statistical and spatial analysis. I produced a final result from 10 iterations of the Monograph 3 geostatistical workflow in about an hour – start to finish – using Exprodat’s Unconventionals Analyst software, an extension to Esri’s ArcGIS for Desktop.
The heavy-lifting
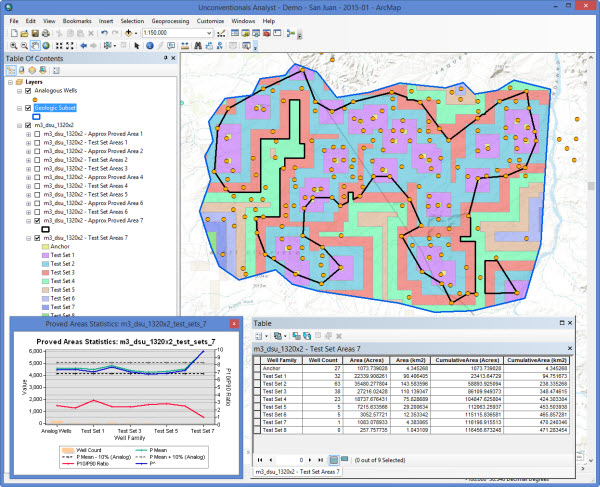
Using the extension’s ability to run multiple iterations in a single process, I started by running 10 iterations of the basic Monograph 3 workflow. This series of computations and analysis represents the heavy-lifting of the process and took about 20 minutes to complete.
Unconventionals Analyst automatically interpreted each iteration using Monograph 3’s rules to produce the summary graph and an interim “proved area” polygon for the reserves evaluator to use as a basis for their own “inward looking polygon” interpretation.
Interpretation and editing
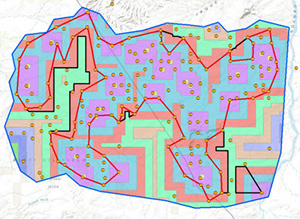
Next, I edited each interim “inward looking polygon” (black outline on map, above and below) using native ArcGIS for Desktop editing tools to create a “final proved area” polygon (red outline on map below) for each iteration.
This was probably the most time consuming and tedious part of the process, but only took about 35 minutes.
Overlay and final result
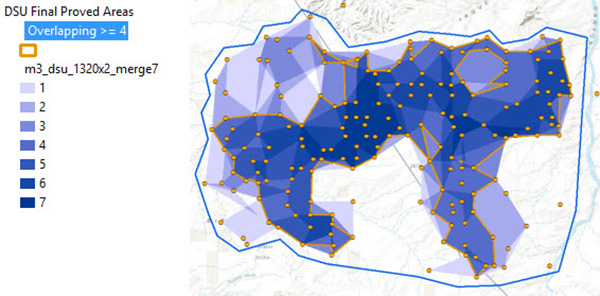
In order to get my final proved area result I used Unconventionals Analyst ability to overlay the proved area polygons for each iteration, analyse the overlaps and calculate the area. This was really quick and only took a few seconds.
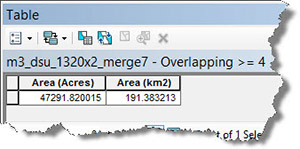
Done! My final area was calculated for me in acres and Km2, as shown below:
Summary
If your company works in mature unconventionals plays, using Unconventionals Analyst for Monograph 3 geostatistical reserves booking would help ensure compliance with reserve regulators, improve reserve booking results, and save considerable time and effort when using the Monograph 3 methodology.
Simple really.
Posted by Chris Jepps, Technical Director, Exprodat.


