In the next of our blogs on Building a Digital Twin within the ArcGIS Platform, we look at the execution of the laser scan surveys of our offices and the initial processing of the data acquired. Missed the early instalments of the series? Check out Part 1 and Part 2 first.
Introduction
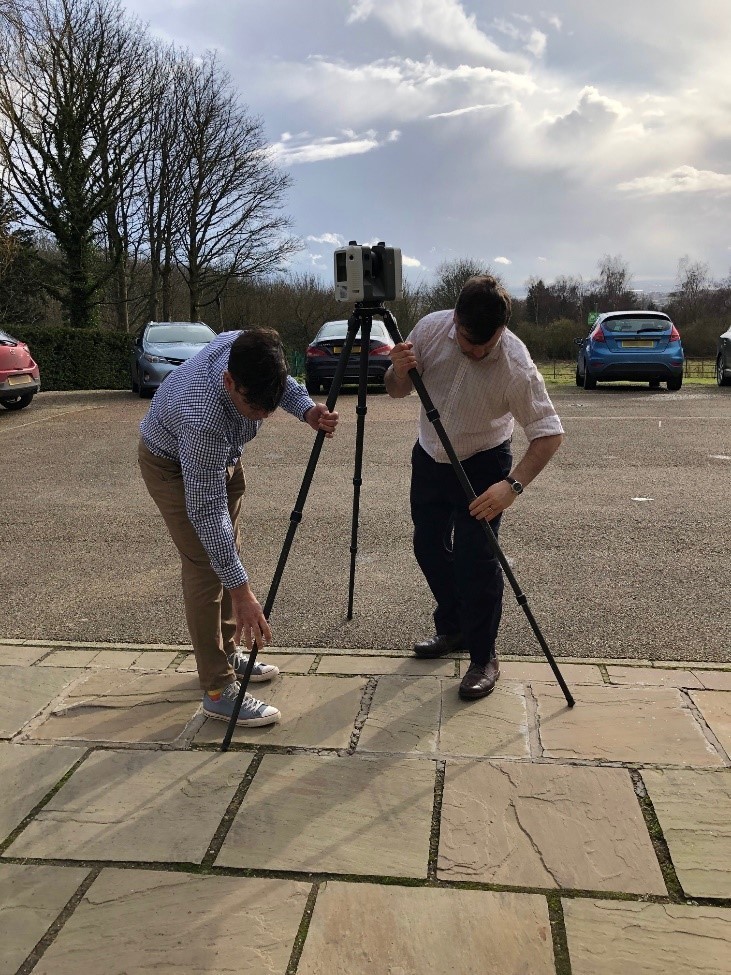
We hired a Leica RTC360 3D Laser Scanner for a week – the hire included an iPad with the Leica Cyclone Field software on it for executing the survey, and a 2 week license for the Leica Cyclone REGISTER software for co-registering the resulting point clouds. The hire service included training in the use of the scanner and the software, enabling us to get up-and-running very quickly.
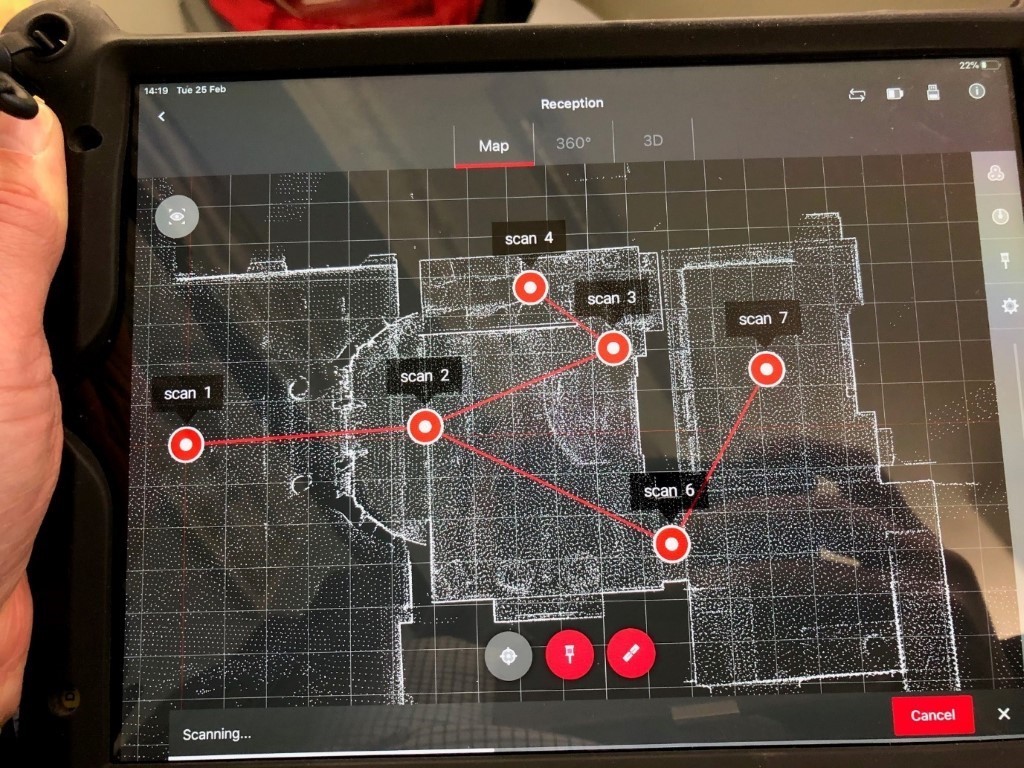
The scanner we’d hired was simple to operate and very fast – each scan took 2 minutes or less (you can select from different resolution and image capture options, but 2 minutes is the slowest it’ll do a scan). It also, very cleverly, works out where it’s going when you pick it up and move it to the next station, meaning that it can pre-register the scans, reducing the effort required to do that.

Figure 2 – the Leica Cyclone Field application in action, showing the automatically created scan registration links (the red lines) between the separate scans (instrument location shown as bulls eye symbols).
After some initial test scanning and processing, we decided that we would scan the whole of our Leeds office at high resolution, both inside and out, capturing high dynamic range (HDR) images for the more interesting parts (this colour information being applied to the point cloud; the default is greyscale intensity values based on the laser returns, which are always captured). We felt that this approach would allow us to appreciate the options, whilst also capturing the maximum amount of spatial detail, but completing the survey within the time we had available. We scanned both our Leeds and our London offices, but we will concentrate here on the Leeds office survey and results.
Survey results
Our Leeds office is split over two buildings – part of the original Elmete Hall, called Kitson House, and a modern two-floor office addition at the rear, called the Nicholson Building. We captured each floor in each building as a separate group of scans, using the same scan settings for each group.
Processing
As each group was scanned, the captured data was loaded onto a Dell XPS desktop with a 6Gb Nvidia graphics card and 40Gb RAM. It was then processed through the Leica Cyclone REGISTER software, which allowed the co-registration of the point clouds within each group to be fine-tuned and for the groups to be co-registered with one another – so, for instance, the cellars sit correctly below the rest of the building.
We trialled some of the other software available from Leica, such as Cyclone Register 3DR, which provides meshing tools (and more) for point clouds, and also looked at some of the open source options, but as we were interested in seeing how much of the processing we could do in the ArcGIS Platform, we opted to export the co-registered, but un-geolocated, point cloud out of Cyclone to the ATSM E57 interchange format.
E57 can be easily processed using FME Desktop (or the Data Interoperability Extension) to LAS format, which is supported natively by ArcGIS Pro. We could have done much more with the Leica tools before bringing the data into ArcGIS Pro – it’s possible some of the hurdles we subsequently faced could have been jumped in advance, so we hope to investigate this in the future.
The remaining initial processing, detailed below, was performed on a Dell Precision 3520 laptop with 4Tb SSD, 2Gb Nvidia Graphics Card and 32Gb RAM.
Geolocating the laser scans
When we first exported the data to E57 format, we opted to merge the data into one file – this was just over 300Gb which proved a little unmanageable. So we re-ran the export, opting to produce an E57 for each source scan – resulting in 128 files, the largest of which was around 3Gb.
A little research determined that FME’s 3D Affiner transformer allowed us to shift the point clouds from their source local coordinate system to our target projected coordinate system within the same workbench we were using to convert the E57 files to LAS format.
Ground control points
We had printed out and laminated some GCP markers, which we’d distributed evenly around the grounds of the office. We collected accurate locations for the centre points of the markers using a Leica GS07 (using NUTM30 on the WGS84 datum, EPSG code 32630). The GCP markers were captured in both the drone and laser scan imagery, allowing us to accurately geolocate both sets of data both absolutely and relatively.
3D Affiner parameters
To calculate the parameters for the 3D Affiner transformer, we first had to retrieve the local coordinates for the centre points of the GCP markers from the point clouds. Having done that, we used some Python based on this stackoverflow answer to retrieve the parameters.

Figure 3 – 3D Affiner parameters used to geolocate the E57 files as they are translated to LAS format.
Preserving Intensity values
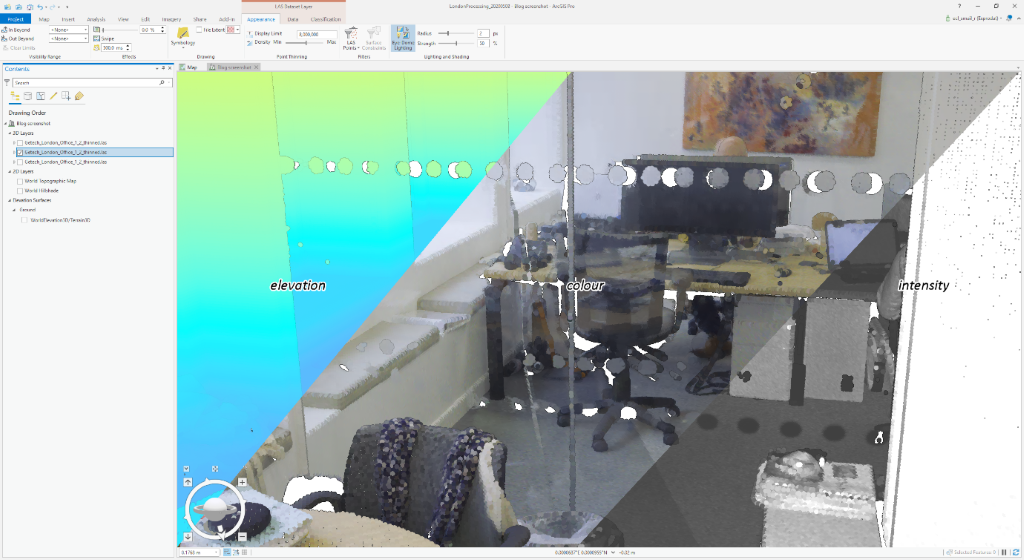
ArcGIS Pro, by default, symbolizes LAS files using their elevation values. As noted above, we’d captured colour information for some of our scans, but just intensity for others (see figure below).

Figure 4 – Three ways that LAS data can be symbolized in ArcGIS Pro – from left to right: by elevation, by colour, by intensity.
Unfortunately it took us a while to notice that the intensity values in our LAS files weren’t quite right – everything was a uniform shade of grey. We’d ignored an FME warning and had to reprocess the data from the E57, having added a PointCloudComponentTypeCoercer transformer to scale the input intensity values to unsigned 16 bit integers.
Results
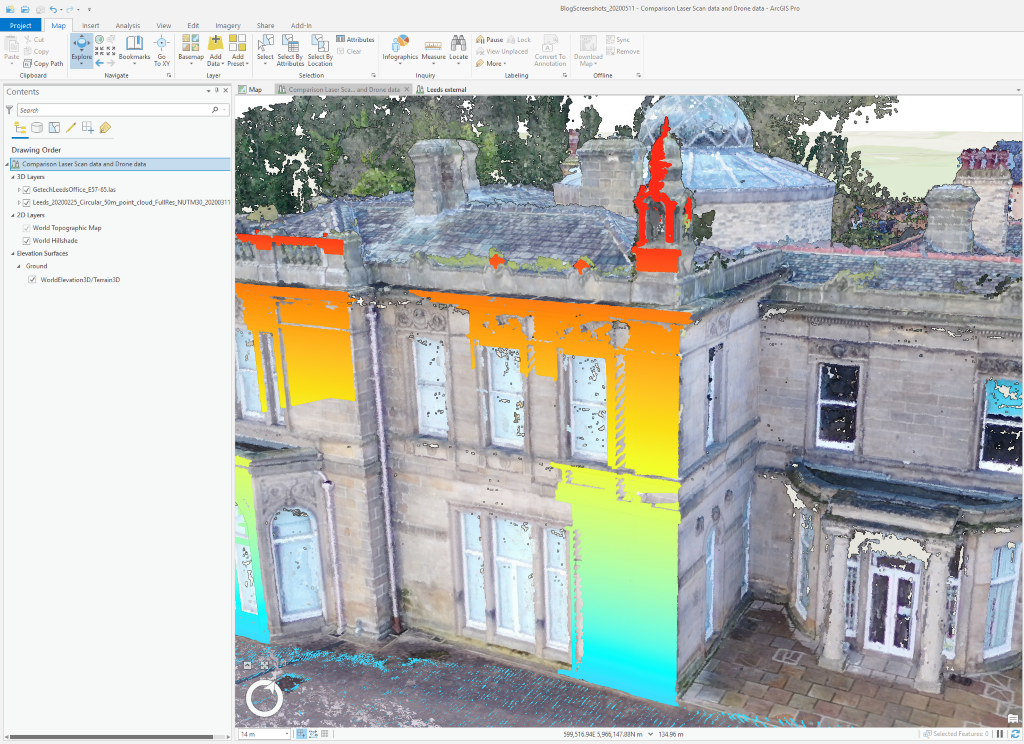
The geolocated laser scan LAS files align well with the drone-derived LAS file, as shown in the screengrab below. This demonstrates the usefulness of the GCP markers, which allowed both datasets to be independently and accurately geolocated.

Figure 5 – Example geolocated laser scan LAS file, symbolized by elevation value, displayed with the Drone-derived point cloud. The laser scanner was located off to the left of the view, causing the shadowing.
At this point, we had 128 separate geolocated LAS files for the Leeds office, weighing in at a collective 352Gb in size. For our London office, we had 26 separate geolocated LAS files, 105Gb in combined size. The processing we undertook to reduce those data volumes and create usable merged point clouds will be the subject of the next blog.
Lessons learned:
- Based on our experience, we would now probably choose to do the whole building at a medium resolution with HDR images, as that would result in a consistent and much smaller dataset.
- Pay attention to FME warnings, as otherwise you may waste time re-processing things.
Posted by Ross Smail, Head of Innovation.


