Depth-to-surface maps can be derived from isopach (thickness) data, and are useful for visualising regional structural trends.
This blog demonstrates how to use mathematic functions in ArcGIS to create a grid representing the depth to a stratigraphic surface in the Viking Graben area of the UKCS (see previous blog for data and area).
Method
Calculating the depth to a surface uses the following principle and requires a surface with a corresponding isopach. In this example we are dealing with an offshore subsurface stratigraphy therefore depths are recorded as positive integers where depths are below sea level.
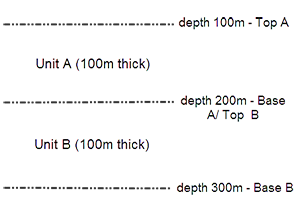
Input data
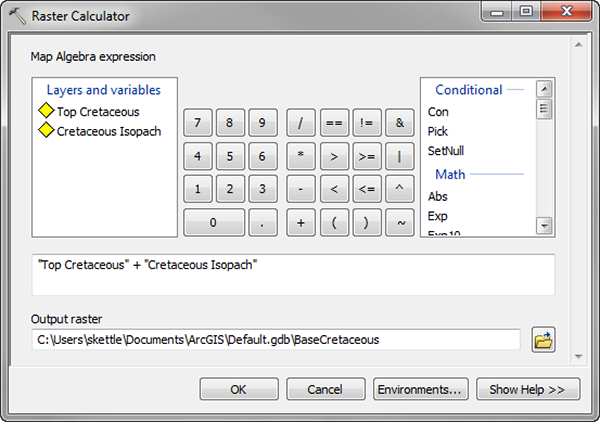
In the following example I used two grids – one representing the depth of the Top Cretaceous (the first image) and the other the Cretaceous Isopach.
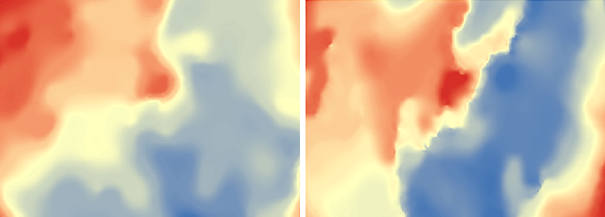
I used these to calculate the depth to the Base Cretaceous surface.
Note that if I wanted to find the depth to a surface using multiple isopachs then some additional processing would have been required to combine the isopach thickness values together.
It is possible to calculate additional calibration derived from elevation values from specific locations such as outcrops, drill locations or picks for the input surfaces to produce a more accurate output surface. This can be conducted by using the surface and interpolation tools in the Spatial Analyst toolbox.
Adding the surface and isopach data
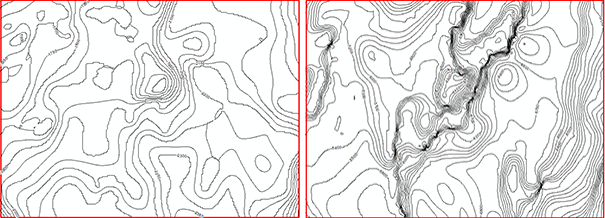
- To help visualise the data I created contours lines to overlie the grids using the Spatial Analyst Contour tool.
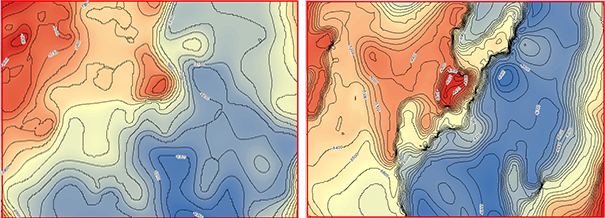
- Calculating the depth to surface: To apply the math function to the newly created grids I opened used Raster Calculator Spatial Analyst > Map Algebra and ran the tool. Raster calculator provides clear and easy to use options for conducting mathematical operations on raster datasets.
The output…!
The output raster represents the depth to the Base Cretaceous from the Top Cretaceous
Depth to base of Cretaceous
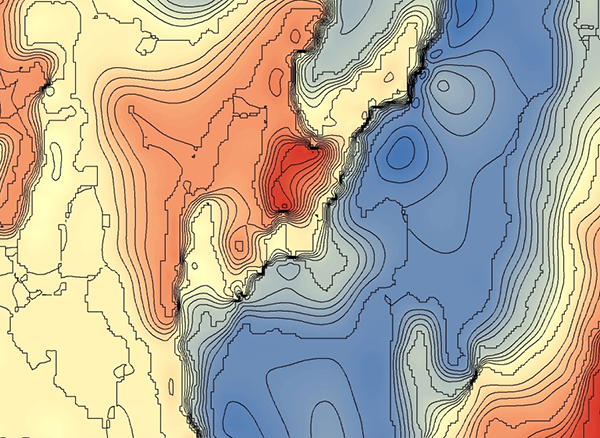
When comparing this calculated surface to the data used in a previous blog on Creating Block Diagrams I can see that it has created an accurate representation for the depth to the base Cretaceous.
The result is a structure map with values in true vertical depth since this process derived values directly from the Top Cretaceous and hence cannot account for dip within the stratigraphy.
Posted by Simon Kettle, GIS Consultant, Exprodat.
References, acknowledgements, further information
- Millennium Atlas sub-surface grids: http://www.expgeo.co.uk


