In our earlier Exprodat blog Creating Geological Block Diagrams, we showed how to create block diagrams using satellite imagery and a digital elevation model. In this blog I look at how to make block diagrams directly from gridded surfaces, creating visual representations of the blocks. The workflows described require ArcGIS Desktop along with the 3D Analyst extension.
Study area
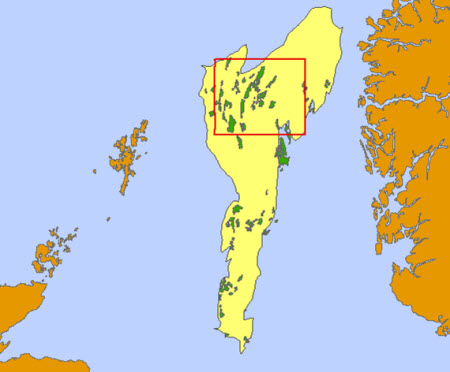
My study area (red box on the map below) is in the Viking Graben Province (yellow polygon) of the North Sea Graben System, in the northern North Sea. The green polygons in the map represent oil fields.
Input grids
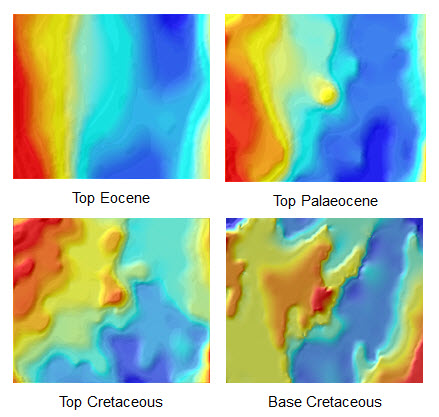
I took four TIFF grids for the study area, representing a sequence from youngest (top of the Eocene) to oldest (base of the Cretaceous), with the Paleocene layer between them. The grids are shown below, coloured so that red represents structural highs and blue represents structural lows.
Filling the gaps: from TIFF to TIN to Blocks
I displayed the grids in a perspective view in ArcScene (supplied with 3D Analyst) by setting the base heights of each grid:
- Use Layer Properties > Base Heights > Elevation from surfaces
- Select the radio button for Floating on a custom surface: where the surface you choose is the grid itself. With the correct base heights set, the separation, and therefore thicknesses, can be seen between each grid surface.
Next I wanted to fill the spaces between each layer in order to produce a block unit for each geological period and epoch; this also returns values for the volumes of each block unit. The first step was to convert the TIF grids to ArcGIS TINs (Triangulated Irregular Network), using the Raster to TIN tool:

Under ArcToolbox > 3D Analyst Tools > Triangulated Surface, I used the Extrude Between tool to generate block units between each layer, using the Study Area polygon to limit the extent of the block created.
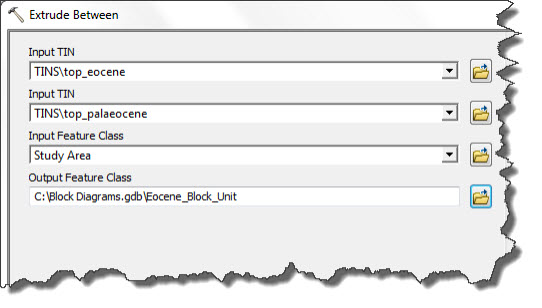
Running the tool three times resulted in three block units representing the Eocene, Palaeocene and Cretaceous volumes in the study area.
Displaying the block diagram
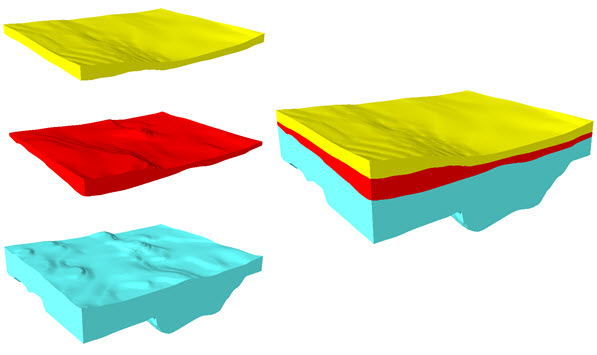
I then displayed the block units in ArcScene – displaying each block unit in turn allows for a detailed look at their general profile, and some top and base structural detail (below, left). Switching on all block units displays a block diagram (below, right).
Come, look inside
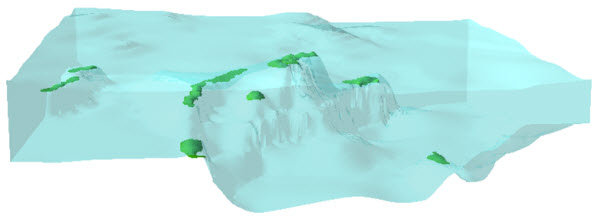
I then made the Cretaceous block semi-transparent, so that I could view the base of the block, and added oil reservoir accumulations (again processed using the Extrude Between tool to place them at the Base Cretaceous) trapped at the contact between the Upper Jurassic and the Base Cretaceous seal along fault footwall topography.
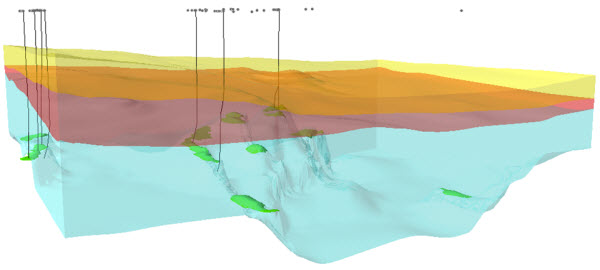
I then added the wells in the area and some borehole data, allowing us to partly validate our blocks – the boreholes intersect the oil fields that they’re tapping!
Is it valid?
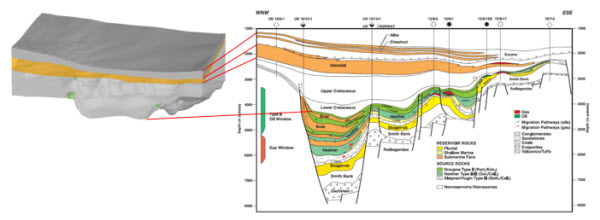
A comparison of my block diagram with a published geoseismic cross section is shown below – the two profiles are not in exactly the same location, but they are close enough to allow us to compare them visually. As you can see, the shape of the Lower Cretaceous contact with the Upper Jurassic oil window is a good match, as are the thicknesses of the Eocene and Palaeocene units – the block diagram we have created appears to reflect reality.
Conclusion
I believe that the examples above show how useful 3D Analyst and ArcScene can be for creating and interacting with meaningful representations of subsurface geology.
In a subsequent blog, I will take these examples further and show how to create cross sections and fence diagrams.
Posted by Mike Phillips, Senior GIS Consultant, Exprodat.
References, acknowledgements, further information
- Millennium Atlas sub-surface grids: http://www.expgeo.co.uk
- Geoseismic cross section from ‘Isaksen et al. 2002. Hydrocarbon System Analysis in a Rift Basin with Mixed Marine and Nonmarine Source Rocks: The South Viking Graben, North Sea. The American Association of Petroleum Geologists Bulletin, v. 86 no. 4 p. 557-59’.
- Related Exprodat course: ArcGIS 3D Surface Analysis for Petroleum


