 One of the many questions that I get asked when delivering a GIS training course is “how do you enhance images – online background mosaics are good for general display but in a frontier basin study area, how do you process images to enhance surface features?”
Most petroleum GIS users use remotely sensed imagery as an image back-drop ranging from a regional basin view to a high resolution image of a well pad. Online imagery, such as ArcGIS online, is excellent for quickly displaying image data but for some applications a background image just isn’t enough. Enhancement of a local image dataset would allow improved geology and geomorphology mapping. This is often carried out in specialist remote sensing software.
Many of the online mosaics datasets are compressed processed images which preclude them from being used for image processing. To enhance imagery you require the uncompressed raw image data.
In oil and gas we often find that, especially in exploration, organisations have access to the Spatial Analyst extension which has many generic geoprocessing raster analysis tools that can be used for image processing.
Colour composites
The online imagery mosaics, commonly using Landsat imagery, have been processed to show surface features representing a true view of the earth surface, simulating the earth surface viewed from space. You can create other types of image display using the Landsat imagery. It has six bands (nominally 30m per pixel) of multispectral image data where the sensor on the satellite measures the intensity of reflected light in six distinct bandwidths filters ranging from blue light to near infrared and short wave infrared. A colour composite is an image created using combinations of these image band data displayed in red, green and blue display channels. You are able to create true and false colour composites for general image enhancement (Drury 2001, Liu et al., 2009).
Landsat data is now freely available from the USGS (USGS, 2009). The data can be used in ArcGIS to enhance local image scenes resulting in improved classification and interpretation of regional geology and geomorphology.
Surface mapping
I’m using Landsat imagery of the Eastern Interior, Sultanate of Oman to demonstrate how ArcView and Spatial Analyst can be used to enhance geological and geomorphological features
The Huqf uplift is a window into the early Palaeozoic, where Cambrian through to Silurian rocks outcrop and are exposed. Here, the Cambrian Shuram – Buah facies outcrop and have been deformed by later Tertiary tectonics and faulting (Ries et al., 1990). The main tectonic features are the Saiwan – Nafun fault with associated Khufai and Buah anticlines.
The regional Landsat mosaic true colour composite (Fig.1a) clearly shows large scale features. However, this mosaic has been created using regional image statistics; the contrast between local features isn’t always clear and often the image appears “washed out”. In Fig. 1b a true colour composite of bands 321 displayed in RGB shows more contrast in surface features. Using the “from current display extent” further enhances the image display (Fig. 2).
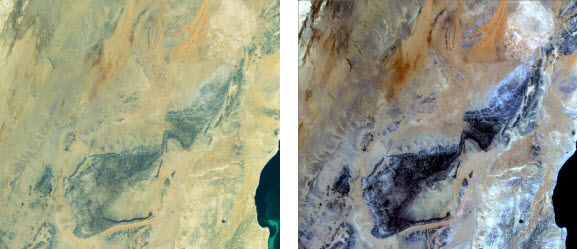
Figure 1. a) The image on the left is a Landsat online mosaic from ESRI ArcGIS Online and b) on the right is a Landsat true colour composite.
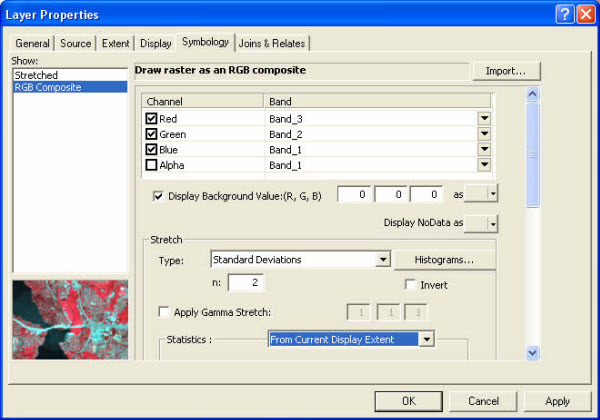
Figure 2. Raster layer symbology with the statistics set to “From Current Display Extent”.
False colour composites (FCC) can be generated using different combinations of the Landsat bands displayed in red, green, blue (RGB) image display channels. An FCC generated using 531 display in RGB is a typical band combination used to map geology and geomorphology (Drury, 2001, Liu et al., 2009). In desert areas, a common FCC combination is 742 displayed in RGB (Fig. 4a and Drury, 2001). These colour composites allow improved interpretation of the local geology and geomorphology (Fig. 3b).
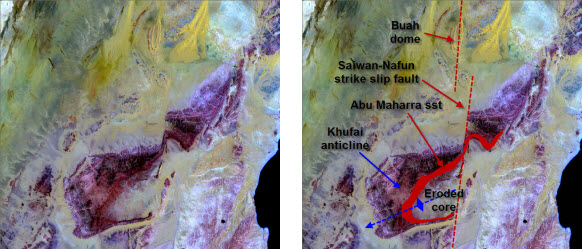
Figure 3. a) False colour composite 531 displayed in RGB and b) annotated image showing key geology features.
The Spatial Analyst extension has tools for carrying out multivariate analysis and classification which use image statistics to enhance the imagery. Principal component analysis (PCA) of the Landsat data further enhances surface features resulting in a more thematic classification. This image (Fig. 4b) when compared to the 531 and 742 false colour composites clearly improves the classification of surface features; the recent sand dunes in red tones, Khufai carbonate rocks in blue with an inner Abu Muhara sandstone in dark blue/purple, and sabhka / salt deposits in yellow. The PCA clearly shows the thin sand deposits to the south of the Khufai anticline located in Wadi Shuram..
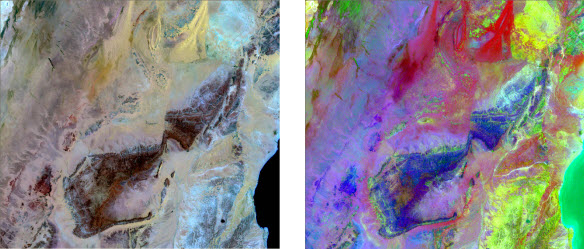
Figure 4. a) False colour composite 531 displayed in RGB and b) principal component image display using PCA bands 124 displayed in RGB.
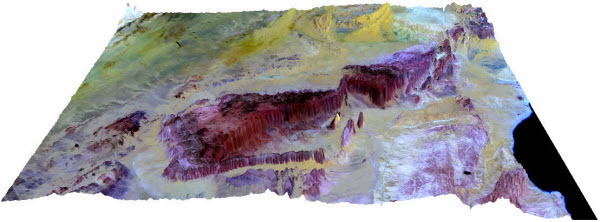
Enhanced images draped over an ASTER GDEM or SRTM DEM clearly show the relationship between surface geology and elevation and can be used to infer subsurface structure (or in the case of 2D or 3D seismic confirm connection of surface to sub-surface structure).

Figure 5. Perspective visualisation, orientated northwards, of the 531 false colour composite draped over an ASTER DEM using ArcScene.
What’s new in ArcGIS 10
The Image Analysis window and the Image Classification toolbar now allow easy access to enhancing imagery in ArcGIS with Spatial Analyst.
Summary
Geology and geomorphology mapping allows a glimpse into the location of basin edge exposures of the Cambrian source and Palaeozoic reservoir rocks in the Oman basin. Associated mapping of recent deposits and sands can help in seismic planning, logistics planning, HSE and downstream applications.
The tailored use of spatial analyst allows GIS users to enhance imagery without having specialist remote sensing software. This “first pass” image enhancement can help target areas for further specialist remote sensing applications and projects.
Understanding imagery and what the colours mean, is often not as straight forward as it seems. It’s becoming easier for the general GIS user to process and enhance imagery, but the observation skills needed to interpret the images are often overlooked. To aid interpretation, perspective viewing of the imagery draped on a suitable DEM not only produces the wow factor, but provides clear information on surface geological structure geometry and natural geomorphological barriers. This is invaluable when planning a new oil/gas pipeline or geology mapping field project.
To find out more on how use ArcGIS for terrain analysis, take a look at Exprodat’s Surface Analysis course.
Posted by Al Davis, Senior GIS Consultant, Exprodat.
References:
- Drury, S. A., 2001, Image Interpretation in Geology, Routledge, third edition, pages 304.
- Liu, J. G., and Mason, P. J., 2009, Essential Image Processing and GIS for Remote Sensing, Wiley-Blackwell, pages 460.
- Pilcher, R., Roberts, G., Buckley, R., and Harbury, N., 1996, Structures within the Mahatta Humaid area, Huqf Uplift: implications for the tectonics of eastern Oman, Journal of African Earth Sciences, Volume 22, Issue 3, Pages 311-321
- Ries, A. C.& Shackleton, R. M., 1990, Structures in the Huqf-Haushi Uplift, east Central Oman, Geological Society, London, Special Publications; 1990; v. 49; p. 653-663;
- USGS, 2008, “USGS Landsat Imagery Release” http://landsat.usgs.gov/documents/USGS_Landsat_Imagery_Release.pdf


