Reducing exploration risk by confirming petroleum source and charge is a major component of petroleum system analysis and is a critical phase of any exploration program.
The use of cloud-penetrating radar data in offshore basins to detect and isolate slicks emanating from sea floor seepage of oil and wet gas is now seen as an important pre-requisite to screening basins prior to far more extensive exploration. The same task onshore relies on optical satellite data that has the disadvantage that resultant images can be obscured by cloud, extreme vegetation cover and highly heterogenous geology, both physically and chemically.
However, many case studies have demonstrated success in targeting onshore seeps, whether looking at spectral microseepage anomalies, direct macroseepage of oil and bitumen at the surface or even vegetation anomalies.
In this blog, we present a case study of how medium resolution ASTER satellite data can be used to screen basins for the evidence for onshore surface seepage. The same project was presented as a poster at the recent AAPG Hedberg Research conference “Hydrocarbon Microseepage: Recent Advances, New Applications, and Remaining Challenges” held in Houston in June 2019 – you can find a link to download the poster at the end of the blog.
Using medium-resolution ASTER data to screen regions: processing
Our case study had 2 aims:
- Automate a workflow using ArcGIS to pre-process and process ASTER satellite data efficiently.
- Gauge how well the spectral processing of the data could isolate signatures from a range of seepage types previously mapped by BP geologists in the 1950/60s in the Zagros Mountains – these maps are held in the Geological Society and record hundreds of seepage localities along with symbols depicting encrustations, impregnations, active seeps, thermal springs and sulphur streams.
We chose sample locations to test the efficacy of ASTER to map the surface seepage signatures.

Figure 1: Workflow for pre-processing and processing data using Python/ArcGIS Pro
A set of Python scripts were developed and incorporated into an ArcGIS Pro Python toolbox. These tools were then used to perform the workflow actions.
Following pre-processing, the most important aspects of the workflow concerned:
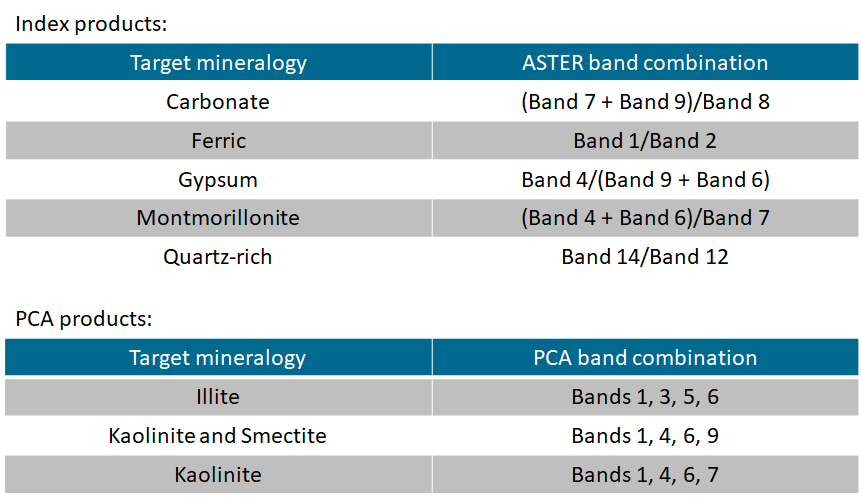
- Band indices – used to highlight specific mineral species, based on their spectral characteristics – i.e. their particular reflectance or absorption features.
- Principal Component Analysis (PCA) – a technique used to reduce the dimensionality of a multi-band image dataset by removing redundant information.
PCA can be combined with the concepts used in band index design to generate principal component images for selected band combinations that target specific mineral species.
Both the Band Indices and the PCAs are then thresholded at both 95 and 99% to isolate the brightest and therefore strongest returns for each mineral.
Following examination of published research, we decided to concentrate on the most prominent reported alteration and precipitation products common to most of the existing work:
- Alteration of clays to kaolinite
- Redox-related ferric-ferrous red bed bleaching
- Precipitation of Gypsum, carbonate and silica
As much of the region is sparsely vegetated, comprising permeable and porous limestone-karst topography, we decided not to look at vegetation anomalies. The few excessively vegetated forests and more extensive lowland farmed areas were masked out.

Table 1: Band Index products
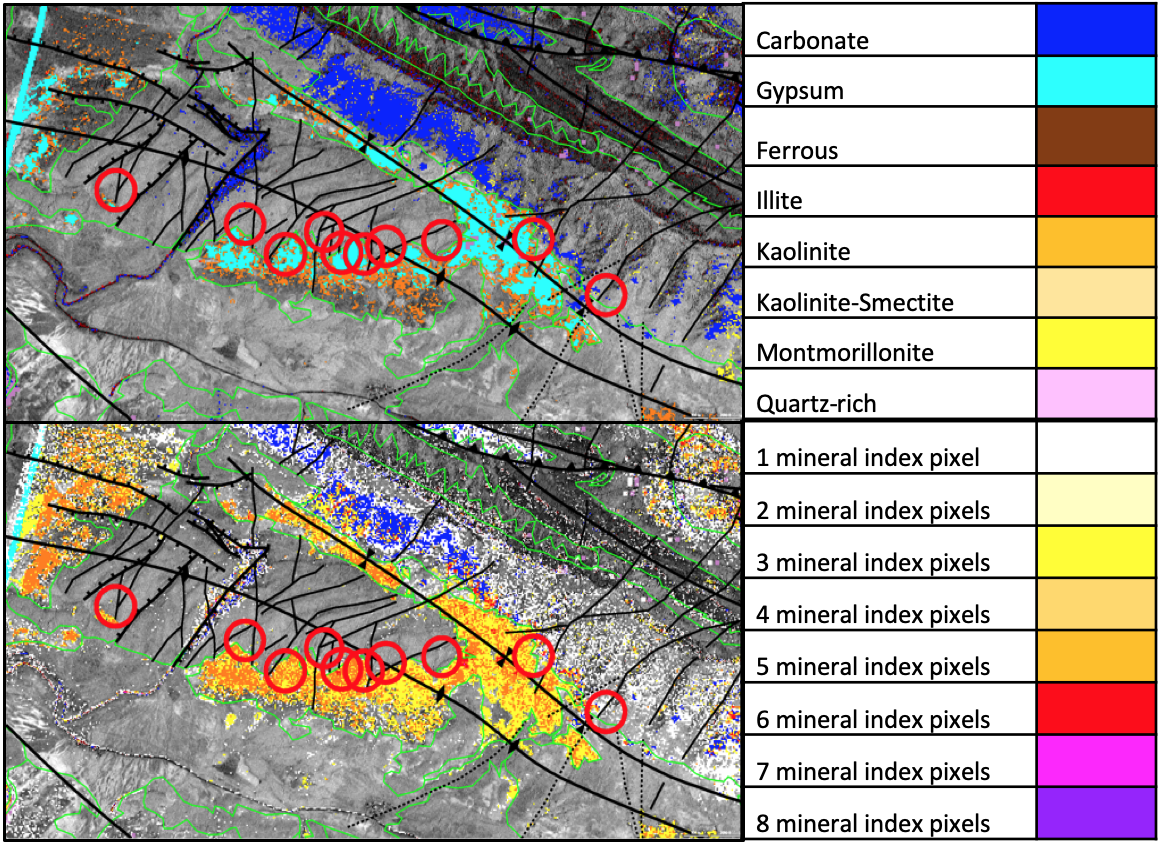
The last phase of the process is to then “stack” the thresholded results such that where anomalous pixels overlay each other a “Seepage Potential Intensity” (SPI) image is created that shows the co-location of multiple (up to 8) anomalous mineral signatures.

Table 2: explanation of the colours for SPI (left) and mineral indices (right)
Comparing previously mapped seepage to processed images: results
The Zagros Foreland Fold and Thrust Belt (FFTB) presents a fine laboratory for remote sensing as a consequence of its aridity and climate, allowing frequent imaging of exposed lithology and geological structure at virtually any time of year. We selected three domains of the FFTB that display multiple surface impregnations and active/inactive seepage and spring phenomena.
The domains themselves are controlled by the Neogene to Present tectonism reacting with pre-existing palaeo-geographic domains with coeval and subsequent development of Neogene (mostly Miocene) evaporite basins. These domains developed thick evaporites known as “Gachsaran” and comprise evaporites, clays, limestones and shales. This geologic unit provides a regionally important décollement surface and mineralogy that reacts enthusiastically with locally sourced migrating hydrocarbon fluids.
The interpretation procedure for each calibration location involved using Landsat and SRTM DEM imagery to provide some detailed geological background at 1:50,000 scale. Each location was then examined using the products highlighted above (section 3) by first overlaying Montmorillonite and Illite Clay 95/99% maps and then overlaying that with our Kaolinite 95/99% maps to show whether alteration from one clay state to the other could be indicated.
The next step was to overlay gypsum, carbonate, silica and ferric 95/99% maps to see if evidence of other potentially seepage related alteration or precipitation indicators were present. The mapped geology provided context both stratigraphically and structurally.
Figure 2 shows the results of the thresholded mineral mapping and the lower image the “Seepage Potential Intensity” results in an area on the northern margin of the Dezful embayment where the deformation and the fold-thrust belt is dominated by propagating and box-fold styles. The red circles superimposed on the images show locations (bearing in mind the inaccuracies in old 1950’s topographic base and geology maps) of seepage mapped by BP geologists.

Figure 2: Top – 8 indices coloured individually; below – “Seepage Potential Intensity”
In this locale, most of the seepage comprised asphalt impregnations and active asphalt seeps, together with a few sulphur streams. Our “Seepage Potential Intensity” map appears to show a good relationship between mapped seeps and high-value stacked anomalies.
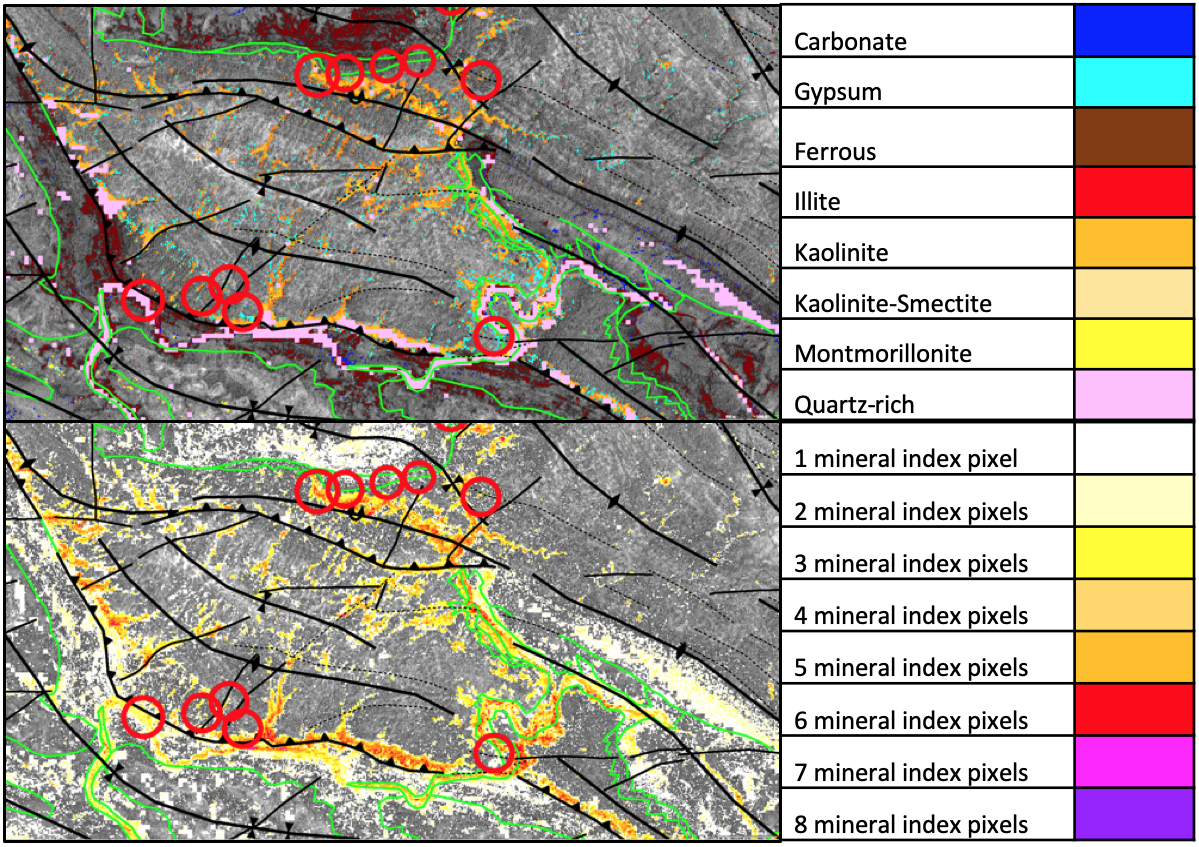
Figure 3 shows the results of an area further south; where the Gachsaran evaporitic geological unit is deformed disharmonically; and surface folds are commonly detached and displaced from underlying anticlinal highs, complicating migration pathways and interpretation. The top image shows the results of the thresholded mineral mapping and the lower image the “Seepage Potential Intensity” results. The red circles superimposed on the images show locations of seepage mapped by BP geologists.

Figure 3: Top – 8 indices coloured individually; below – “Seepage Potential Intensity”
Two concentrations of seeps were mapped by BP:
- North – a set of 5 seeps in the northern are that are all Gach-e-Turush style, i.e. subsurface oxidising alteration of seepage typically involving gypsum, jarosite, sulphuric acid, and sulphur.
- South – another set in the south of the image (sulphur springs), all developed along the thrust front.
Both seep types suggest gas seepage, match closely with our mapped stacks and indicate that further anomalies may lie along the entire thrust front.
Observations and conclusions
Our case study leads to the following observations and conclusions on mapping onshore seeps using ASTER data:
- Process automation has been a success and many images can be processed quickly.
- The method has shown Seepage Potential Intensity anomalies over or very close to previously mapped seepage although some of the mapped seeps show no alteration/precipitation anomalies using the ASTER data: out of 91 seeps mapped by BP, we found anomalies (95% threshold level) over or close in 29 locations: ~ 32%.
- Mapping the geology (structural and sedimentological) at 1:50,000 scale to help understand the geomorphology and land use is essential for context and explains some of the complications arising from:
- Clay rich lithology masking the effects of seepage.
- Water bodies/stream signatures occluding seepage associated with water tables interacting with stream beds.
- Anthropological effects, such as recent reservoirs, arable and built-up terrains.
- We have devised a very useful tool for screening large areas using ASTER that provides a viable method to map Seepage Potential Intensity (SPI) to help highlight areas for mapping with more detailed 3.7m resolution WV3 spectral data and field study.
Recommendations for future work
Our case study has shown that it is possible to map oil- and gas-phase onshore seepage using semi-automated ASTER data processing and interpretation. We believe we can further refine the technique with improved processing using machine learning techniques as well as adding a number of tweaks to our present workflow:
- We wish to show that SPI mapping can be refined by date stacking – using images from multiple dates over the same AOI to see whether seeps are persistent or have any other temporal relationship: we will investigate whether machine learning can help to process multiple images and associate closely matching signatures and extrapolate the results.
- To date, we have only used basic processing – no pixel unmixing or cross-talk methods, for example, that may eke out subtle signatures from adjacent pixels.
- We have had no field-based spectral control, so cannot utilise the spectral libraries fully: we would welcome the opportunity to carry out fieldwork and further image-based projects in client areas of interest.
- Some previously mapped seeps may be too small to map with the 15/30/60m pixels used in this study and we would like to run our processing using WV3 satellite data with 3.7m resolution bands that virtually match the important mineral bands of ASTER. Again, ideally, we would test this over accessible client study areas so we can add a field verification step to the process.
Find out more
To learn more about our case study, feel free to download the poster that we presented recently at the recent AAPG Hedberg Research conference “Hydrocarbon Microseepage: Recent Advances, New Applications, and Remaining Challenges” held in Houston in June 2019, or contact us to discuss how we can help apply the same techniques to your own areas of exploration interest.
Posted by Mike Oehlers, Director (Tectosat) and Ross Smail, Head of Innovation (Getech).


