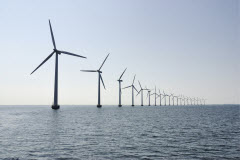
 In the past four decades the United Kingdom Continental Shelf (UKCS) has proven to be a major area for hydrocarbon exploration and production. However, as governments across the globe focus more on addressing climate change, energy production must in turn encompass more renewable technologies. The EU target to source 20% of Europe’s energy from renewables by 2020 is ambitious, and offshore wind energy is expected to provide a large share of the UK’s contribution.
The UK government therefore is undertaking two key activities that will contribute to delivering a further 25 GW from offshore windfarms: (1) the government’s UK offshore energy SEA; and (2) The Crown Estate’s Round 3 programme, in which the Crown Estate’s role will revolve around programme delivery, and zonal contract management, i.e. working with partners to indentify suitable windfarm sites within the zones on offer.
At Exprodat we wondered whether we’d be able to employ our Exploration Analyst software (normally used for rapidly evaluating and grading petroleum licenses and locations) to analyse and rank the proposed Round 3 locations.
Data Inputs
Some of the key factors for locating offshore wind farm developments, as noted by the SEA, are wind speed, water depth, proximity to areas of high electricity demand and availability of connection points to onshore transmission. Exploration Analyst is able to use any ArcGIS Desktop supported vector (point/line/polygon) or raster format as inputs, so data was sourced in spatially-ready formats. Data was obtained from a multitude of sources (e.g. JNCC, DECC, English Hertiage) for input into the location ranking process, including the Renewables Atlas, which provides maps of the distribution of renewable energy resource factors, i.e. wind, wave and tidal, based on the Met Office Numerical Weather Prediction Model (NWP).
Information and datasets provided for the Oil and Gas sector (e.g. pipelines data, surface infrastructure and subsurface infrastructure) were also compiled for use as inputs into the analysis.
Region of Assessment – Holderness
Due to the relative abundance of datasets available in the area, we decided to focus on the Holderness Round 3 region for our proof-of-concept analysis (the purple polygon in the middle of the map below).
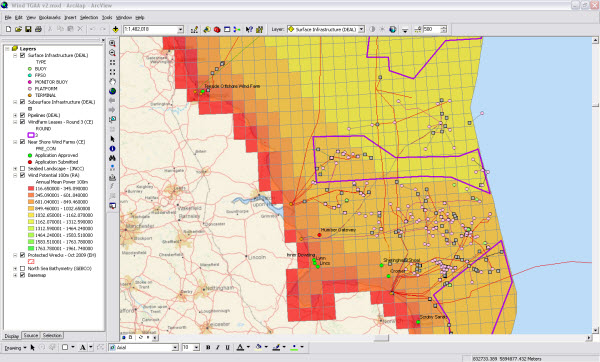
The table below describes the input datasets, any queries or filters applied to them and the analysis types applied (these layers are also shown in the map above).
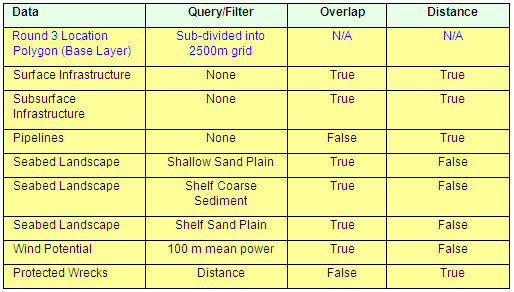
Part of the advanced functionality of Exploration Analyst is the optional ability to sub-divide the ‘base layer’ (i.e. the layer containing the locations that you wish to rank) polygon areas into an equally spaced grid and then carry out the analysis on each of the resulting cells. The Holderness Round 3 covers approximately 160 km x 40 km, and was sub-divided on-the-fly by the tools into 845 equal 2.5 km x 2.5 km grid cells.
Analysis and Scoring
The location ranking schema used in the analysis was based on general assumptions (potentially erroneous, but good enough for our ‘proof-of-concept’) that the optimal locations were close to existing infrastructure (pipelines, platforms, etc.), did not contain protected wrecks, had specific sea-bed geology types (see table above), and high potential wind energy values. Each input layer was then spatially analysed with respect to each grid cell in the base layer (the Round 3 Holderness region), and scored based on the results.
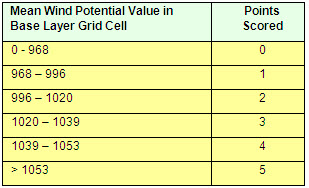
The ‘Wind Potential 100m (RA)’ layer (power at 100m, calculated per square metre of rotor swept area) was given a weighting of 2 as it was perceived as the most important in the analysis, and then scored using the following classification:
The Seabed Landscape data was analysed by assessing percentage overlap of suitable geology type with each grid cell, while proximity analyses were applied to the Wrecks and Infrastructure layers. Scoring schemas for these layers were then applied in accordance with the assumptions of the analysis.
Results
The results of the analysis are shown below. The analysis, once the initial data had been gathered, took only a minute or so to complete. Using Exploration Analyst we were then able to iterate the analysis and scoring by re-loading parameters from previous runs, tweaking the set-up, and re-executing. This enabled us to rapidly analyse some of the sensitivities within the data.
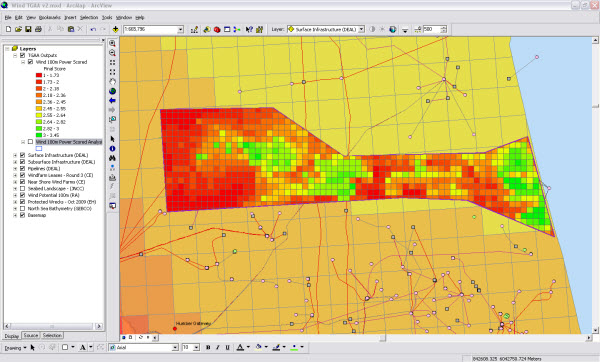
Clearly our analysis is not perfect, and further enhancements to the ‘proof-of-concept’ should include integration of additional data, e.g. shipping lanes, radar data, cable network, connection points, fishing areas, water depth and economic factors, etc., as well as correcting our initial assumptions. However, it does show that Exploration Analyst has the ability to rank potential offshore wind farm locations based on multiple and complex datasets, without the analyst having to build a bespoke Geoprocessing model.
Posted by Adam Smith (GIS Consultant) and Chris Jepps (Technical Director), Exprodat.


