Introduction
An elevation profile charts the elevation along a straight or irregular line. Their uses within the Oil and Gas industry include:
- Infrastructure planning – eg, pipeline routing
- Field work route planning
- Providing a topographic profile for use in geological cross sections.
In this blog I look at the construction of vertical profiles for fictional potential pipeline routes. This analysis is important but only a small part of a study into a pipeline route.
Down to business
There are two main workflows for creating vertical profiles in ArcGIS, which both require 3D Analyst Extension. These include using a feature class and the 3D Analyst tool Interpolate Shape as well as simply tracing a line over the DEM.
Firstly I got hold of a surface
- I downloaded a section of a freely available digital elevation model (DEM) of Asia.
- I converted the DEM to a Triangular Irregular Network (TIN) using the Raster to TIN tool in ArcToolbox, the use of which requires a license of the 3D Analyst extension.
Using Interpolate Shape Tool
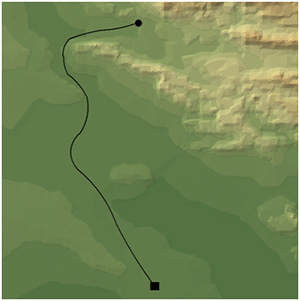
- In ArcMap I then created a line to represent my first possible pipeline route, as shown below.
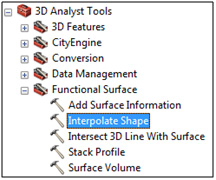
- In ArcMap open the 3D Analyst toolbox and the Interpolate Shape tool
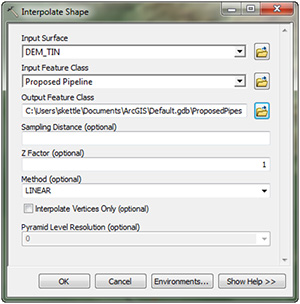
- Open the 3D Analyst toolbar and then select the line using the normal selection tools
![]()
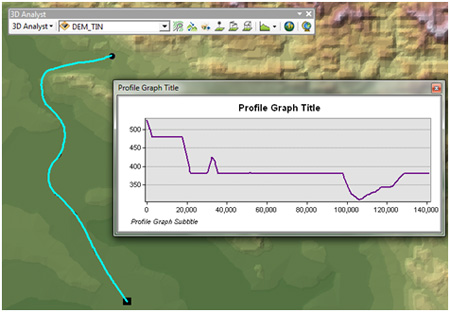
- On the 3D Analyst toolbar the Create Profile Graph button – will be activated. Upon selecting, a graph will be produced.
Tracing a line freehand
1) In ArcMap, making sure all features have been deselected. Open the 3D Analyst toolbar ensuring the TIN surface is selected as my target layer in the 3D Analyst toolbar, and then selected the Interpolate Line tool.

2) I digitized a line following my first possible route and then clicked the Create Profile Graph button ![]() – (greyed-out in the screenshot above) – to construct my first elevation profile:
– (greyed-out in the screenshot above) – to construct my first elevation profile:
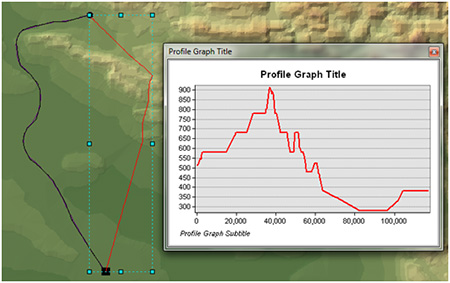
Note: Right-click the graph to view and change its properties – properties such as axis data, graph type and symbology.
Comparing profiles
Using the same workflow, I created another possible route and elevation profile, shown in red in the map and graphs below.
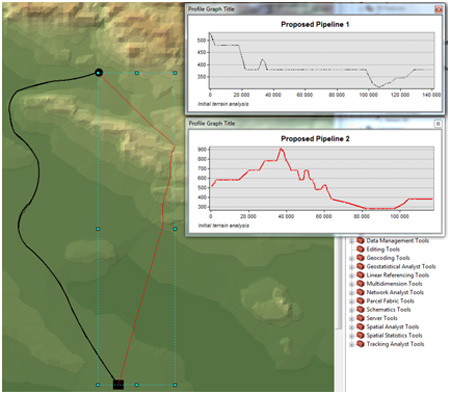
This is great but I would rather have the two profiles on a single graph so that the information can be easily compared and exported to a report – to do this, I selected the lines (using ![]() ) and then chose Profile Graph to create a graph showing both profiles.
) and then chose Profile Graph to create a graph showing both profiles.

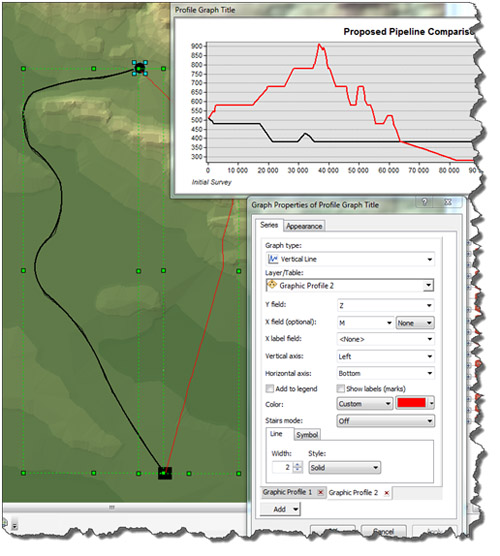
Analysing the profiles
The Graph Properties dialog allows you to process your profile data using a number of mathematical functions including: Median, Mode, Cumulative and Trend. To apply these functions select Add/New Function at the bottom left of the Graph Properties dialog:

I wanted to display the cumulative elevation gain, so I added a cumulative function to the graph.
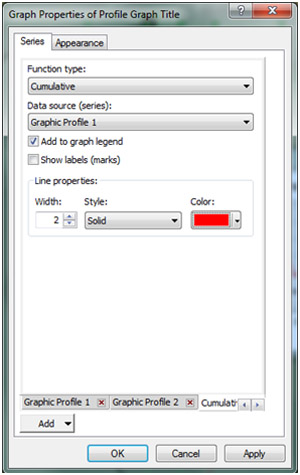
This allowed me to compare the total elevation change for each possible route, as shown below.
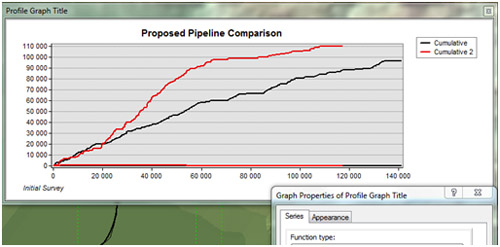
Creating vertical profiles delivers a visualization of the terrain of any given route; this analysis can be used as part of a larger project such as planning a pipeline route and on smaller projects such as forming the profile of a geological cross-section.
Further to this visualization, using Graphs in ArcGIS allows us to use graph functions to view the data in various ways such as cumulating height over distance as in this example.
Posted by Simon Kettle, GIS Consultant, Exprodat.


