Exprodat’s parent company Getech recently announced its acquisition of H2Green, which is building a network of production, storage and refuelling infrastructure to service the emergent hydrogen economy. Over the past 6 months, we applied our geospatial skills to help H2 Green identify strategic locations to service future hydrogen demand. One of the many strands in this effort regarded understanding rail freight. This blog explains how we created a set of data products to map rail freight activity in the UK, to support our overall analysis.
Rail freight
Freight trains run between commodity producers and their consumers/hubs and ports of entry/exit – so, for instance, there are regular scheduled freight journeys between aggregate quarries and seaports.
Most freight trains can run on diesel fuel, to allow them to run on non-electrified portions of the network and to allow them to keep to timetables in the event of power supply outages. Green Hydrogen presents an attractive alternative fuel for freight trains, one with no carbon footprint, and hence rail freight constitutes a potential Hydrogen market.
As such, we decided to try and better understand the operational characteristics of rail, such as routes and frequencies, to assist in ranking potential locations for siting Hydrogen facilities.
Network Rail, which maintains the UK’s rail infrastructure, publishes the freight train schedules via its free data feeds. We downloaded the Winter 2020/21 schedule and processed it to extract a table listing all the scheduled journeys:
The documentation provided for the data feeds allowed us to quickly understand the information provided – basically each journey is defined as a set of waypoints (one row per waypoint) and each waypoint is identified by a TIPLOC code (a TIming Point LOCation). Geolocating these waypoints was therefore our initial challenge.
Where’s that TIPLOC?
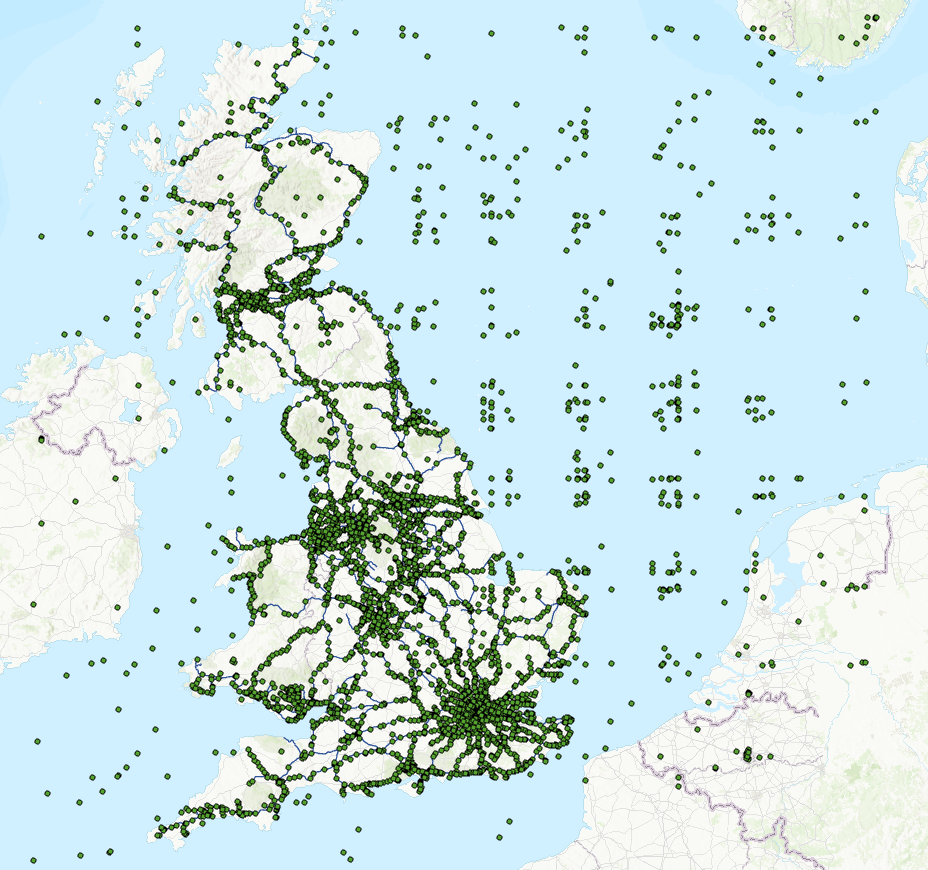
The OpenRailData Wiki does provide a geography dataset, but it has some issues (see below, at least some of these issues may be intentional) and isn’t entirely complete (or, at least, we failed to find correct locations for a large number of the TIPLOC codes used in the Winter 2020/21 schedule).
However, using a combination of this and other sources, combined with summary tables generated from the schedule information, and supplemented by imagery analysis, we focussed on the critical TIPLOCs and generated a feature class which we could use to create route lines for each scheduled journey.
Railway tracks into routes
We could have processed the journey waypoints into route lines directly, but that would have resulted in an inaccurate and unattractive ‘mess’ (to use a technical term), in which at least some of the connecting lines would be some considerable distance from the actual physical railway line that the route that they represented ran on.
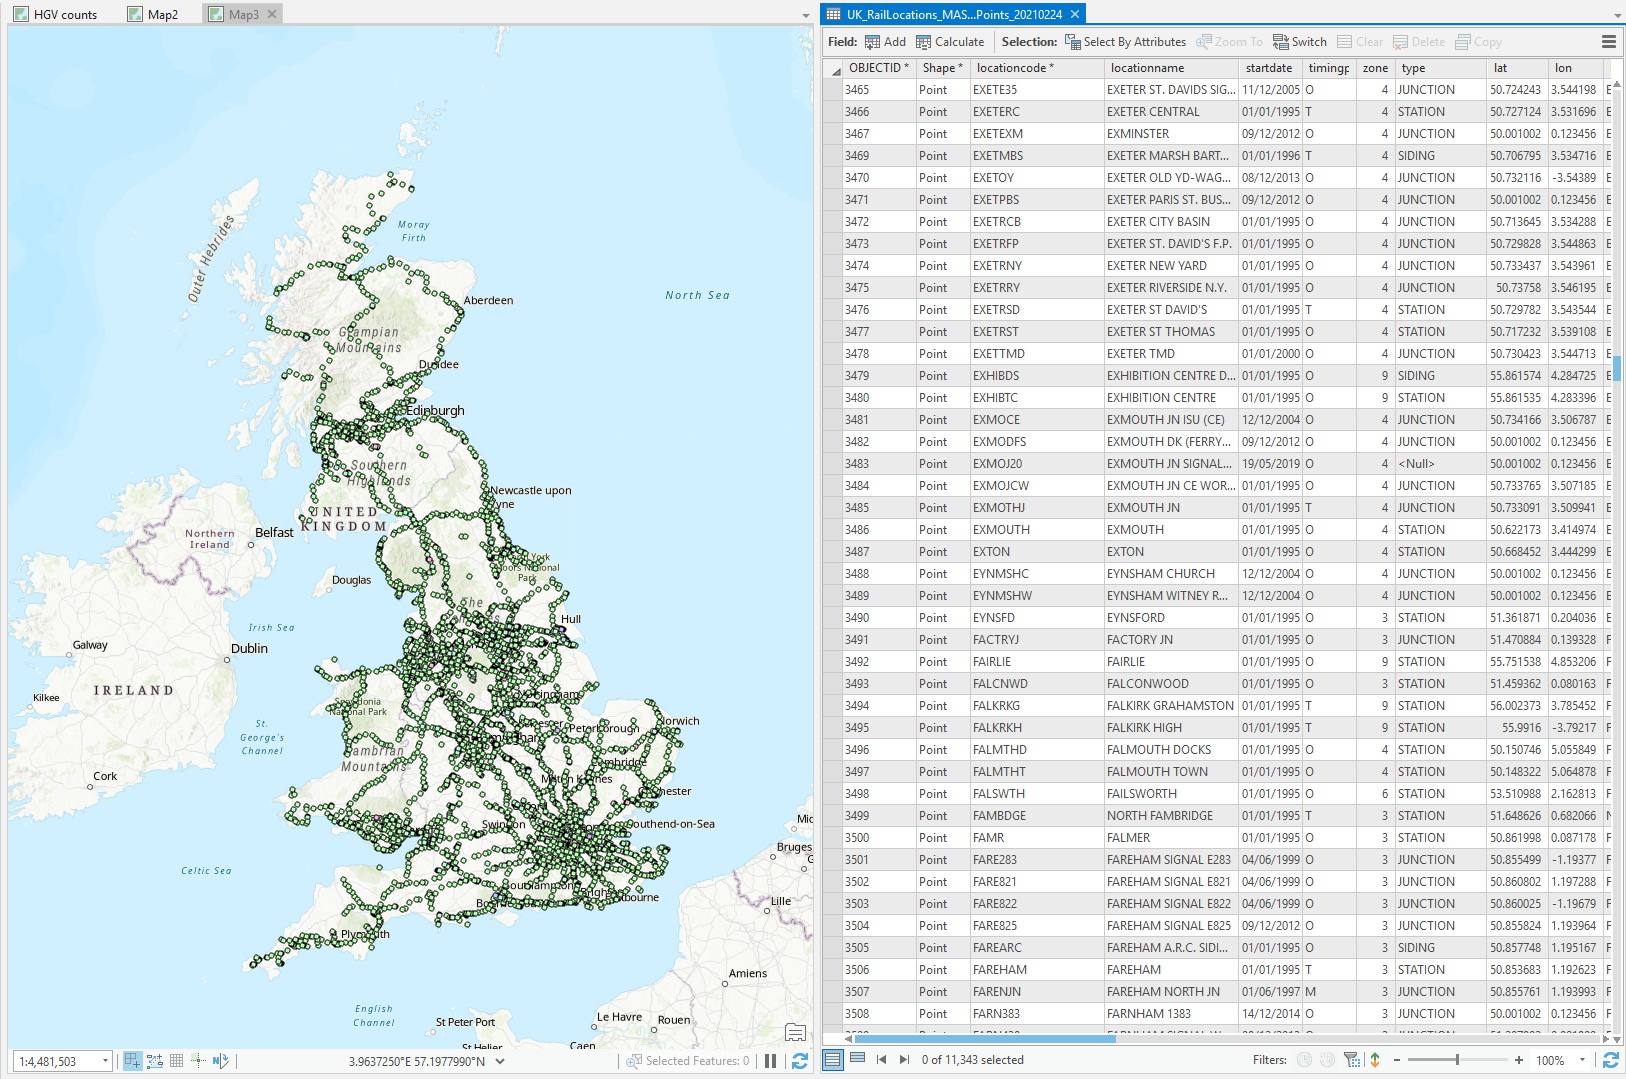
We opted instead to collate a rail network dataset using a variety of source datasets, including the Ordnance Survey’s OpenMap data, which we then combined with the journey waypoints using a custom routing tool to create a featureclass with 18,000+ lines in it, each representing one distinct route.
The custom routing tool shown above performs a simple routing analysis, which determines combinations of line segments that can be used to move between adjacent TIPLOCs on a route, and then selects the combination that has the shortest length. Iterating and expanding the processing to other routes allows incorrectly located TIPLOCs to be identified and corrected for the rail network featureclass and so greatly improves the output result.
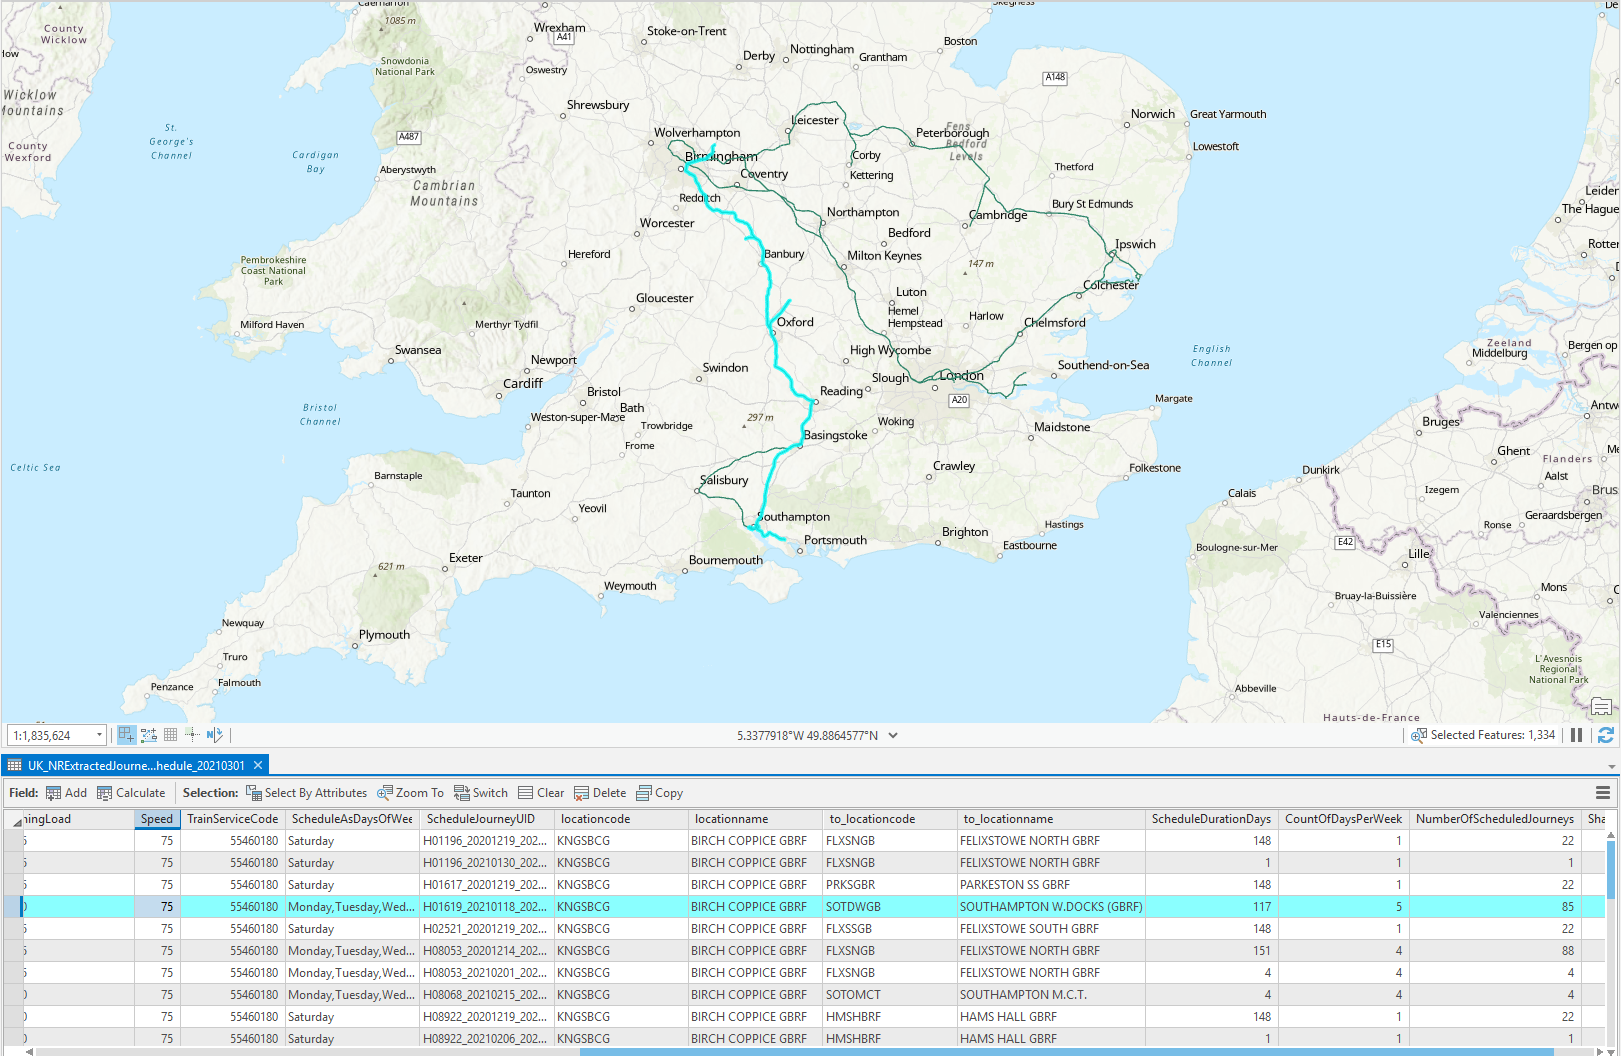
We appended a variety of information to the generated routes, including the schedule information and predicted load tonnage, and the names of their start/end points, from which other information, such as ownership and function can be retrieved.
This supplementary information allows the data to be ‘sliced-and-diced’ to view the routes running to or from particular locations, or on behalf of particular companies, or for particular commodities, increasing its analytical value considerably.
The example below shows routes from Birch Coppice, Tamworth – highlighting one that goes to Southampton Docks on every weekday.
Train frequency per line segment
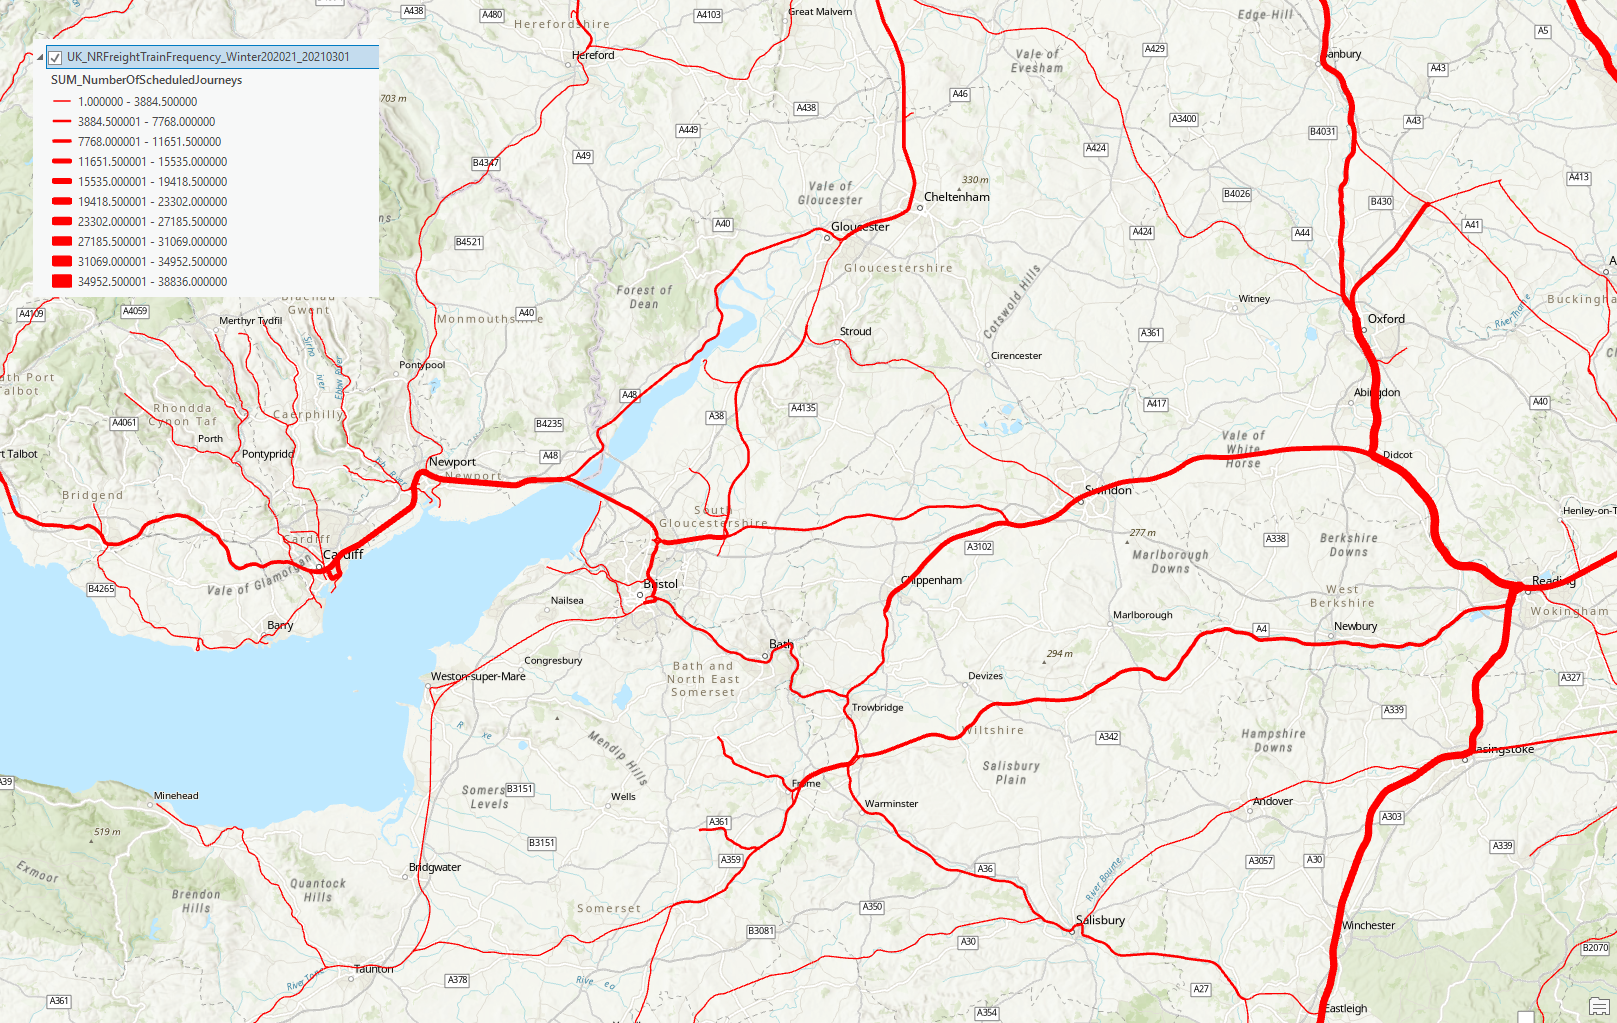
Each route definition also has a start/end date and a frequency – some routes are only scheduled to run once, some are scheduled to run every day for 4 months – and this information is attached to the lines.
This allows the creation of a line featureclass attributed with the total number of freight train journeys scheduled to run over each segment to be created, providing the general ranking support we were aiming for in our analysis.
Using our supplemental route information we can target particular companies or commodities, and thereby support more complex analyses and market segmentations. We can also use this same data for looking into other questions, such as the transportation emissions for particular industries.
A similar analysis can be performed for passenger trains, which are obviously another potential customer for Hydrogen, and variants – using different data sources – provide similar ranking information for customers running HGV, bus and other types of fleets. Such information is then combined with a variety of other spatial data to provide a spatial ranking score which can be incorporated with commercial ranking scores to determine which sites are preferable as locations to site new Hydrogen facilities. We hope you have enjoyed reading this blog. If you’d like more information on our location analytics capabilities and services, don’t hesitate to contact us.
Posted by Ross Smail, Head of Innovation


