We often use ArcGIS Desktop’s buffer tool simply to select areas within set distances from a feature or features we are interested in. However, buffering can be used in more complex ways such as to produce a set of concentric buffers – this can be useful when looking at suspected migration of petroleum away from mature kitchen areas.
In the example below, I have a scanned map of source maturity from the Jurassic, North Sea, showing areas for mature, immature and basement. The blue box is the extent of my area of interest.
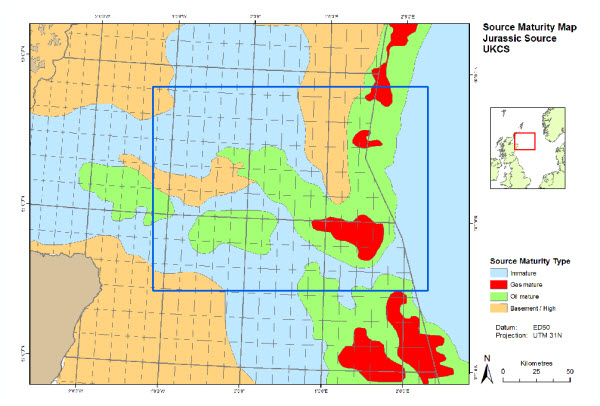
For my petroleum play let’s assume that I am interested in areas of potential exploration up to a distance of 20km from the mature areas, where lateral migration of hydrocarbons may have occurred.
Using the Multiple Ring Buffer Tool
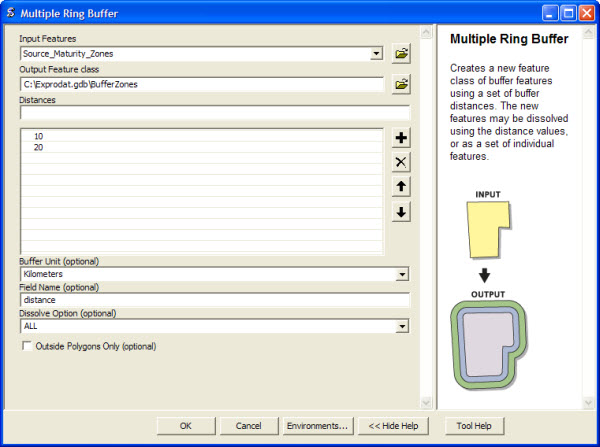
Using the ArcToolbox Multiple Ring Buffer tool (ArcToolbox > Analysis Tools > Proximity > Multiple Ring Buffer) I select distances out to 10km and 20km from the mature source areas represented by the oil mature polygons. I’m going to model 2 buffers so that I can assign different risks to the buffered zones when making my common risk segment maps, e.g. using Exploration Analyst.
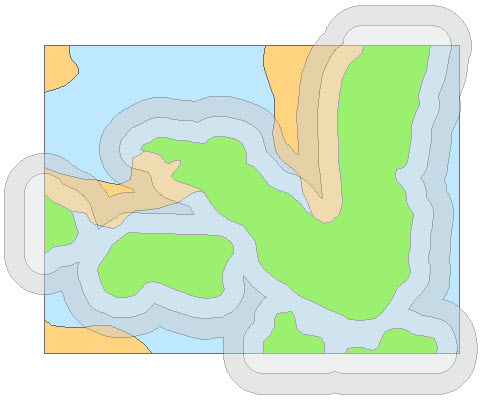
Now I set the multiple ring buffer layer display property (Layer Properties > Display) to 50% transparency, so the buffers can be seen overlain on the original map.
Using the Clip Tool
To complete the workflow, I need to exclude any basement areas that intersect my buffer zones, so that my result gives only potential 10km and 20km migration zones. For this I use the Clip tool.
First I need to select the polygons that I want to clip the buffer layer with – in this case the oil immature polygons. An easy way to do this is selecting them from the attribute table.
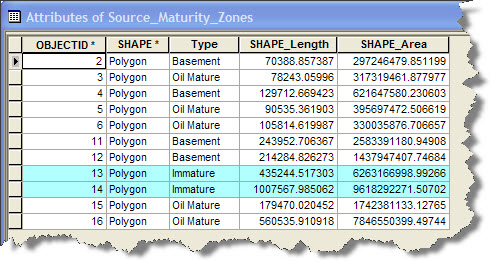
When these are selected, I use the clip tool (ArcToolbox > Analysis Tools > Extract > Clip) to clip the buffer zones using the source mature polygons.
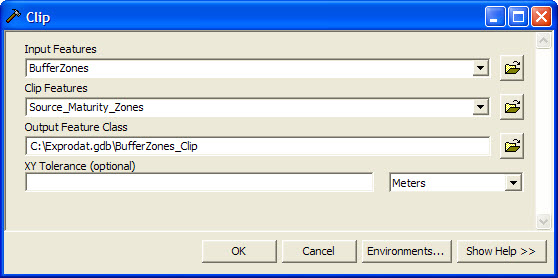
The result produces just the areas I want to include in my analysis.
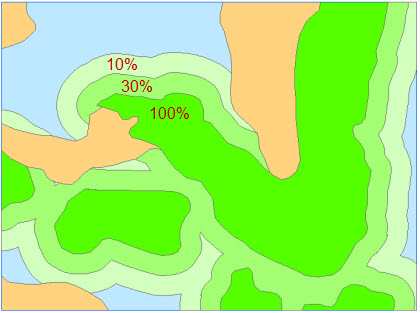
So now when I create my common risk segment maps I can assign a high probability of source presence to the core (bright green) areas (e.g. 100%), and asign lower probability values to the zones of potential lateral migration, with probablilty values decreasing with distance from the kitchen (e.g. 30% then 10%).
Posted by Mike Phillips, Senior Consultant, Exprodat.


