Another spreadsheet of coordinates!
When planning seismic lines it’s typical to have a spreadsheet of start and end point locations, representing the seismic lines to be shot in the survey. In ArcMap it is possible to generate a set of lines from these points using a single tool – the XY To Line tool.
Workflow
Prerequisites: In order to ensure that the lines that you generate in ArcMap are accurately located, you need to know the coordinate reference system in which the start and end points are supplied.
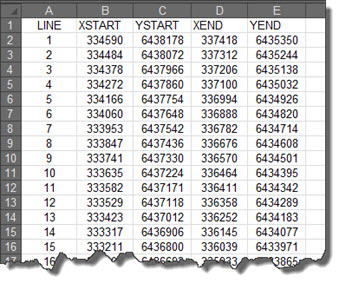
The XY To Line tool requires that the input spread sheet has 5 columns of data, as illustrated in the screenshot below. The column names don’t have to match those that are shown, but the names shown are clear and concise and hence we would recommend their use. These columns of data are:
1) Line number – a unique identifier (LINE). This can be text-based (eg, ‘Line 1’), or numeric (as shown in the screenshot).
2) Start point: X coordinate (XSTART)
3) Start point: Y coordinate (YSTART)
4) End point: X coordinate (XEND)
5) End point: Y coordinate (YEND)
 Figure 1. Spreadsheet layout
Open ArcMap and add the appropriate work sheet from your spread sheet to the data frame – this will add it as a table to your ArcMap document. Note that the Table of Contents view will change from List by Drawing Order to List by Source, allowing you to see the newly added table in the Table of Contents – it will have the same name as the work sheet you selected from the spread sheet.
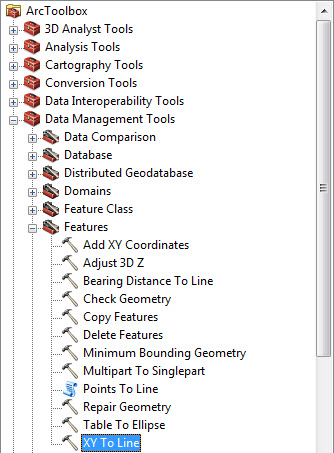
Once you’ve successfully added the work sheet, open Arc Toolbox and navigate to the following location:
Data Management Tools > Features > XY To Line

Figure 2. Tool location
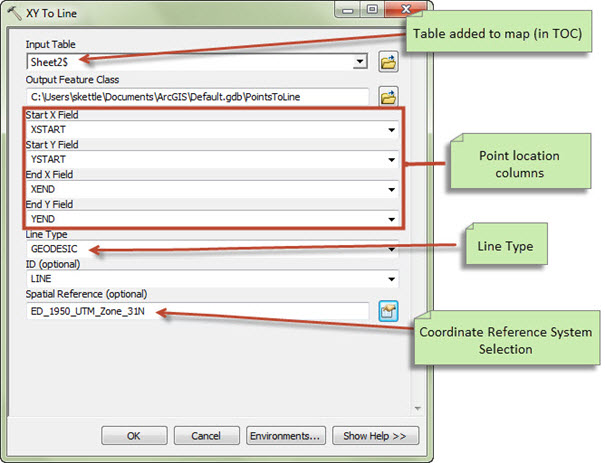
Double-click the tool to open it, complete the tool parameters as appropriate (as illustrated in the screenshot shown below) then click OK to run the tool and wait for the process to complete.
Notes on the tool parameters
Input table – select the table that you added to your ArcMap document.
Start/End X/Y – select the appropriate field for each of these values – note that only numeric fields are listed in the drop-downs.
Line Type – there are a number of ways of constructing a line between two points on a spheroidal (or spherical) surface. A discussion of the differences is outside the scope of this blog – the help shown in the XY to Line tool gives further information. For most purposes the default option, GEODESIC, will provide the most accurate result.
ID – select, if desired, the appropriate field to add as a unique identifier for each line – note that both numeric and text fields are listed in the drop-down.
Spatial Reference – select the coordinate reference system in which the start/end points are defined. Failing to do this correctly will lead to your generated lines being inaccurately located.

Figure 3. Tool parameters
Et voilà!
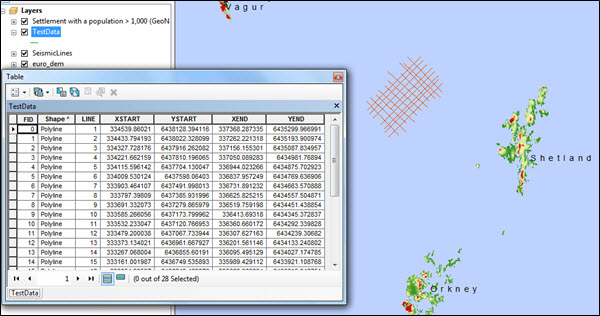
Once the tool completes, the newly created polyline feature class will be added to your ArcMap document, ready to be symbolised to your requirements.

Figure 4. Polyline features drawn in ArcMap
![]() Watch this blog as a video: Using the XY To Line tool
Watch this blog as a video: Using the XY To Line tool
Thanks to Fiona Buckingham and Devlyn Robson for their comments on this article.
Posted by Simon Kettle, GIS Consultant, Exprodat.


