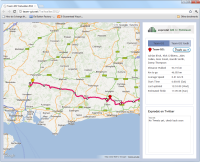
This year two teams from Exprodat decided to enter the Oxfam Trailwalker 2012 event. We thought it would be fun to develop a map-based application to track the positions of our teams and devised a system whereby the walkers would carry smartphones containing built-in GPS receivers for gathering position information. This information would then be uploaded to the internet and displayed, in almost real-time (a couple of minutes delay), within a web-based GIS mapping application. Before we got too enthusiastic, we checked the Vodafone (our provider) online coverage map to make sure that the route didn’t have coverage holes in it.
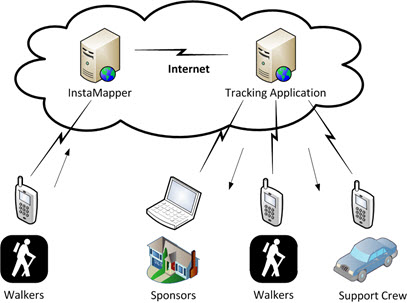
Figure 1: Application architecture
The creation of the tracking application (see figure 1b) required a number of components to be integrated.
Figure 1b: Exprodat’s Trailwalker 2012 tracking application
The route
As well as showing the teams’ position, we wanted to be able to calculate and display how far along the route each team actually was. To do this, we needed the route in digital form. We created this by using the South Downs Way vector line from the OpenStreetMap organisation as a starting point, editing it using the hardcopy Trailwalker route maps and Esri’s ArcGIS Online satellite imagery map service as reference.
In order to (partially) validate it, the captured route was projected to British National Grid and the length calculated – it was around 101km (compared to the stated 100km). A practice walk indicated part of the reason for the discrepancy – some of the paths ‘followed’ on the satellite imagery weren’t actually the paths that you’d walk when on the ground – see Figure 2.
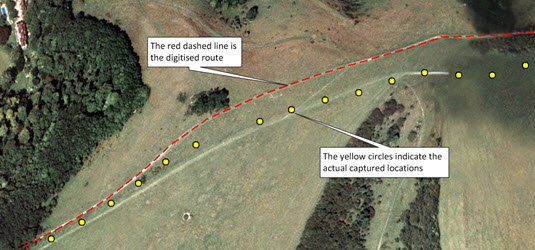
Figure 2: Route errors
The route was exported to a simple text format (JSON) for display on the map, and also stored in an Esri File Geodatabase for use in the server application for calculating the teams’ distances along the route.
Smartphone application
Early in the year we upgraded our company smartphones to the new Apple iPhone 4S, which is equipped with GPS. We wanted to use an off-the-shelf app to gather and upload the position information. Having installed and trialled a number of these, we decided that the free InstaMapper app was the best choice – it uploads the data to an InstaMapper server, from where it can be easily retrieved using the InstaMapper REST API. Positions are sent once a minute (when travelling at walking pace), which was perfect for our requirements.
Tracking application server
Rather than using our own office-based servers, we decided to use an Amazon EC2 server, to reduce the risk of hardware and network issues causing the application to fail. Creating a suitable server (with a database installed and ready-to-go) was trivial. We pointed a domain that we had previously purchased at the new server, and the infrastructure was complete – now all we had to do was write the applications required to power the tracking application. Two applications were required – one to download the location information from the InstaMapper server and process it in various ways, and the tracking application itself.
Processing application
This application had to retrieve the teams’ locations from InstaMapper, process them to generate the appropriate statistical information, such as distance along the route, and then store this information in a database, from where it could be accessed by the tracking application. We used Esri’ ArcObjects to do the grunt work, re-projecting the incoming Latitude-Longitude positions to British National Grid (and also Web Mercator) and then calculating the closest point on the route for each position – this then allowed the distance along the route to be calculated.
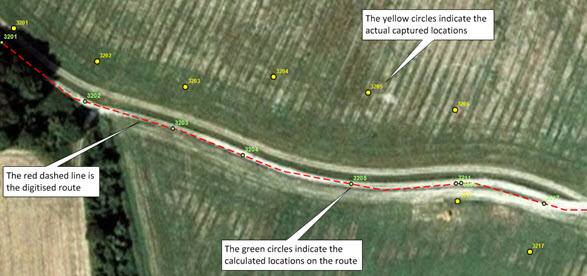
Figure 3: Snapping GPS locations onto the route
Figure 3 shows the result of calculating the closest points on the route to the actual captured locations. The spread of the yellow points away from the obvious route illustrates the fact that the GPS locations vary in accuracy, depending on a number of factors
Tracking application
The tracking application was to be accessed by the walkers using smart phones, the support team using iPads and the sponsors using any number of devices including regular desktops. We looked at creating a separate site for mobile (using jQuery Mobile or Dojo Mobile) which is the traditional approach to mobile access. However, a new approach called Responsive Design is emerging, which allows you to create a single web site that adapts to the device on which it is being viewed. It not only allows you to adapt and scale items for the mobile device, but also allows you to prioritise the items most important to the mobile user.
One of the key concepts in creating a responsive site is that of dividing the screen sizes up in to breakpoints (Figure 4). Since this site is a proof of concept we chose a relatively simple set of three breakpoints, centred on the iPad 3. Anything with screen dimensions less than the iPad was considered mobile and anything greater was considered desktop. For a more complex set of breakpoints see this Responsive Design blog by the BBC who chose 6 breakpoints, including both landscape and portrait orientations.

Figure 4: Screen size breakpoints
With the devices identified the display priorities for each of the devices were defined:
On a mobile device the map should take up the full screen and all the other elements should be hidden – a mobile menu button should be provided to access them.On a tablet an intermediate menu should be used to hide some of the location informationOn a desktop device all items should be shown at once.
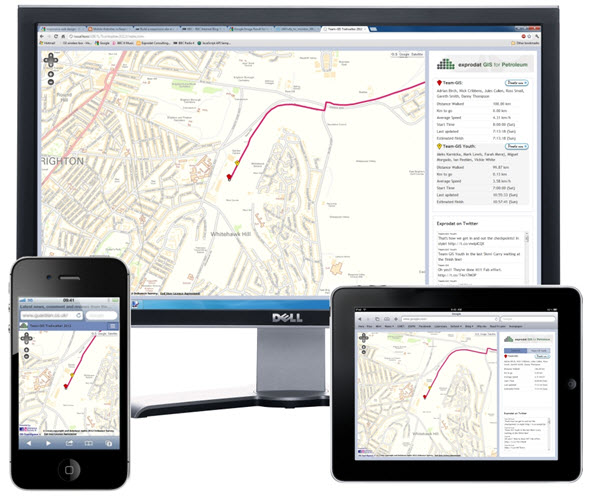
Figure 5: Responsive views of the tracking application
When developing responsive applications, you can view how the application will appear by resizing your desktop web browser – the page will scale and adapt dynamically as you change the size of the window. As you resize the page CSS media queries assign different css styles based on the current viewport width (Figure 6).

Figure 6: Mobile navigation control hidden on iPad by css media query
Mapping APIs
The tracking application retrieves the teams’ position and statistical information, in JSON format, from the server using RESTful web services. The position information is then used to plot the teams’ locations on the map using the mapping API and the statistical information is displayed in tabular format.
There are a number of free mapping APIs available, some offered by companies that also provide free access to mapping data. As the Trailwalker challenge is UK-based, we decided to use the Ordnance Survey’s OpenSpace API , which provides access to Ordnance Survey mapping data. Touch support is not yet implemented in the version of OpenLayers supported by OpenSpace, so we employed a JavaScript code library created by Anders Brownworth to add this capability.
Additionally, we wanted the application to be able to display satellite imagery, but were unable to find a suitable free map service that could be integrated with the OpenSpace data. We decided to use the Google Maps API to provide this capability. Hence the completed application contains two separate mapping interfaces, which are switched between by using a conventional ‘basemap’ selector (Figure 7).
![]()
Figure 7: Basemap selector
The coordinate reference systems (CRSs) used by the two sets of mapping data are actually different – the Ordnance Survey data uses British National Grid, whereas the Google maps data uses Web Mercator. This, in case you were wondering, is the reason why the server application projects the incoming Latitude-Longitude positions to both of these CRSs – the teams’ location information is retrieved in the CRS appropriate for the currently displayed base map.
In addition to providing location and statistical information, we also added in a basic Twitter feed displaying Tweets from the teams and their support crews. This used the Twitter REST API to retrieve Tweets from specific users and then display them in the tracking application. Based on the time that the Tweet was made, an approximate position for it was calculated, allowing the Tweet to be displayed on the map, as shown in Figure 8 (the photo was taken as the sun rose).
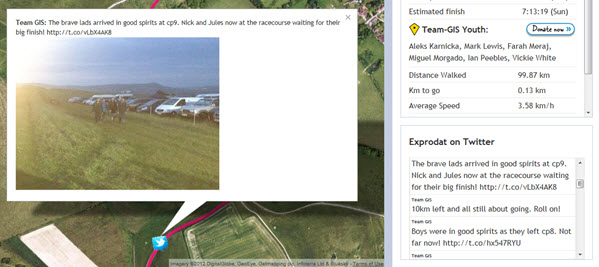
Figure 8: Support crew Tweet
The challenge itself
The two Exprodat teams, Team-GIS Youth and Team-GIS, had different start times – Team-GIS Youth set off at 7am, with Team-GIS following them at 8am. This added an additional competitive element to the challenge, which the tracking application enhanced by allowing the teams to see how they were faring against each other. A minor blip in InstaMapper uploads for Team-GIS was corrected by restarting the mobile phone, but otherwise the tracking application worked perfectly.
The challenge was dominated by the weather. It started raining at approximately 12pm and continued until about 6pm (and then came on again later). This, combined with weeks of rain beforehand, turned the route and the checkpoints into quagmires.
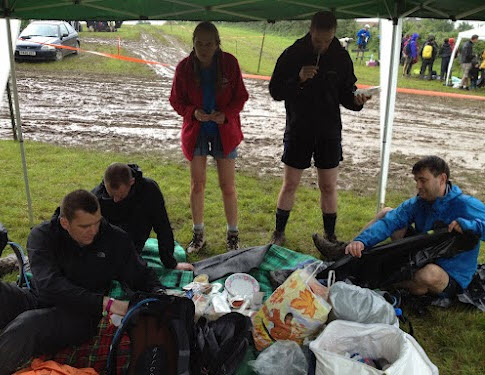
Figure 9: Team-GIS enjoy the English summer
However, both teams pressed on, Team-GIS Youth sadly being reduced in strength by injuries at checkpoint 3 and then at checkpoint 6. The night section proved particularly challenging, but the support crews for the teams buoyed their spirits and kept urging them onwards.
So – who won?
There had been some gentle banter between the teams regarding who might finish first, but the injuries to Team-GIS Youth slowed them down and Team-GIS overtook them just after checkpoint 4, approximately 40km and 9 hours (10 hours for Team-GIS Youth) into the challenge. Team-GIS eventually finished at around 07:15 on Sunday, and Team-GIS Youth finished at 10:55.
I think it’s fair to say that both teams were delighted to have finished and to have raised over £6000 between them, but won’t be hurrying to repeat the experience! If you’d like to add to their totals, please see their sponsorship websites:
- Team-GIS (Adrian Birch, Nick Cribbens, Jules Cullen, Ross Smail, Gareth Smith, Danny Thompson)
- Team-GIS Youth (Aleksandra Karnicka, Mark Lewis, Farah Meraj, Miguel Morgado, Ian Peebles, Vickie White)
Animated fun
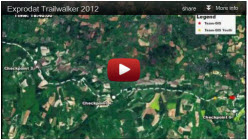
Back in the office, we downloaded the complete position records for both teams and loaded them into ArcMap. As the position data contained the times at which the positions had been recorded, we made the position layers ‘time aware’ and used the Time Slider functionality in ArcMap to generate a video showing a section of the course.
Figure 10: Exprodat Trailwalker 2012 Real Time GIS Movie
Posted by Ross Smail, Head of R&D, Exprodat, & David Wilton, GIS Developer, Exprodat.
