As we progress towards releasing version 3.1 of Data Assistant for ArcGIS Pro (due out within a few months), I couldn’t resist sharing a sneak peek of what’s coming. Some of these features have been heavily requested since we teased some R&D work on voxels a while back.
1 – Seismic Data as Voxels
Folks have been dropping into our DMs regularly to find out how they can get hold of this functionality ever since we teased some R&D work on this a while back. Seems you guys really want to view your 3D seismic data in voxels format!
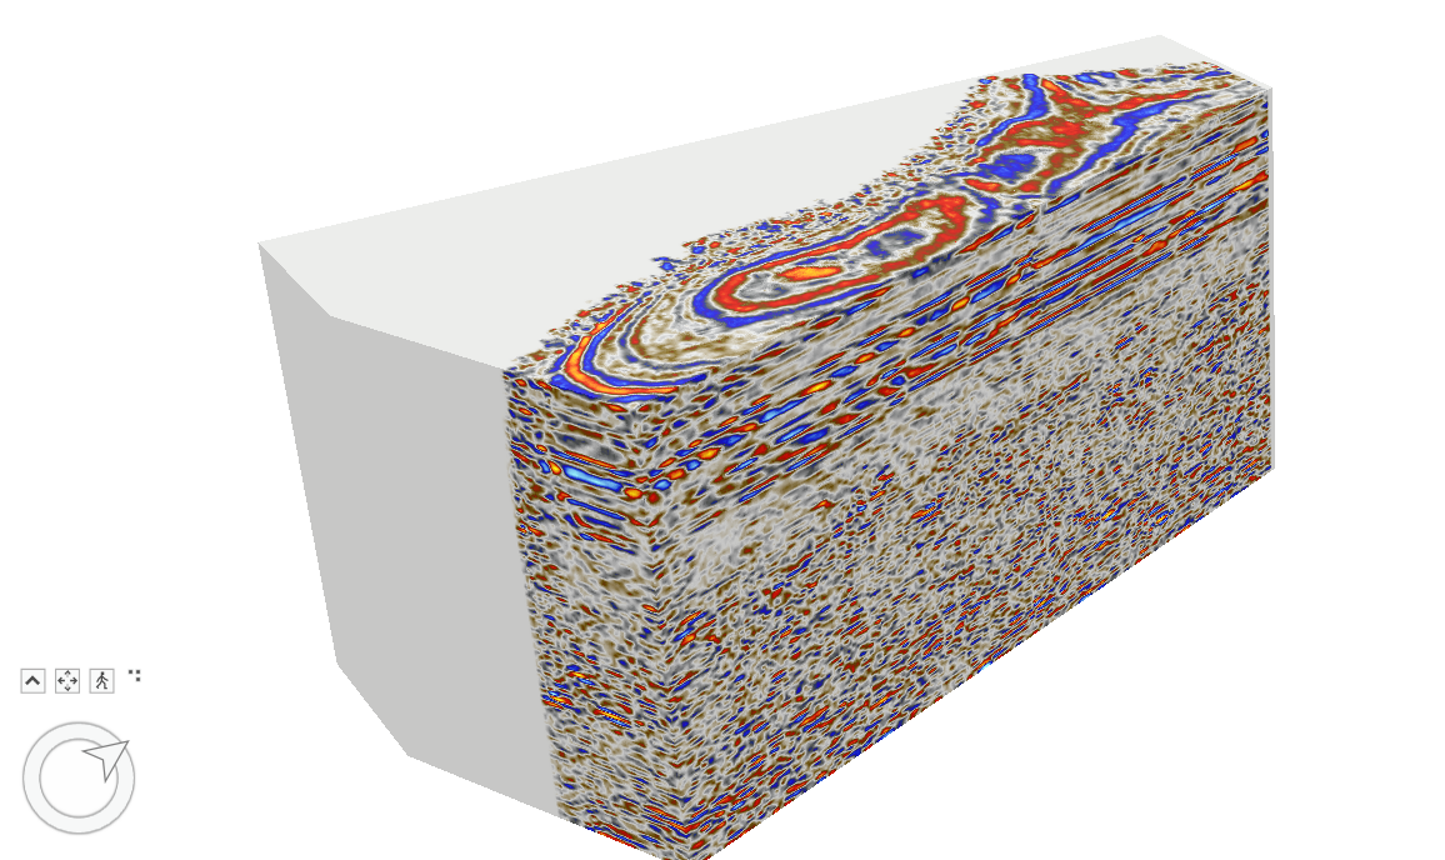
So, we’re adding a feature to extend our current SEG-Y Explorer tool and allow you to import 3D seismic data as a voxel cube. This allows you to create stunning viaualisations like the below seismic cube in ArcGIS Pro’s 3D window.

2 – Curvilinear 2D Seismic Lines in 3D Space
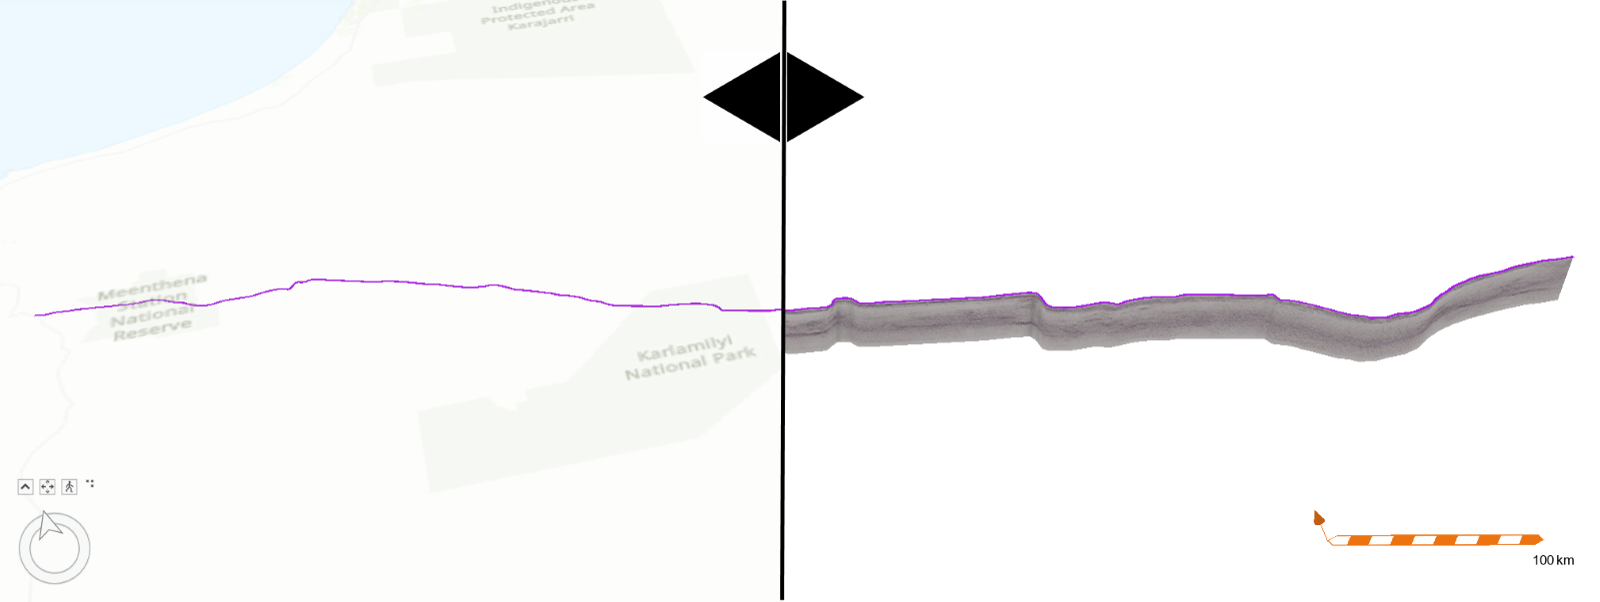
Seismic data does not just come in 3D cubes, and for some time the SEG-Y Explorer tool in Data Assistant has enabled you to create multipatch images directly from your 2D and 3D seismic data. We’re now enhancing that functionality to allow the multipatch image to follow a much more complex geometry, for example as commonly seen on onshore 2D seismic navigation lines.
Use this to create beautiful visualisations of your regional seismic lines in ArcGIS Pro’s 3D window – check out an example of an 850km long 2D seismic line below!

3 – Import Cross Section Images in 3D Space
Going through the process of making seismic multipatches fit curvalinear features gave us another great Idea. Surely folks want to plot cross-section images in 3D space as well? This could include geological sections, gravity profiles, stratigraphic columns, images from reports and papers, etc.
So, we’re introducing a new tool into Data Assistant that lets you import a cross section picture (e.g. jpg, .png) and plot that picture along a line. Below you can see an example where I’ve loaded a schematic cross-section along a line offshore Gabon, and am viewing it in an ArcGIS Pro 3D ‘scene’.

4 – Batch Import Deviation Surveys
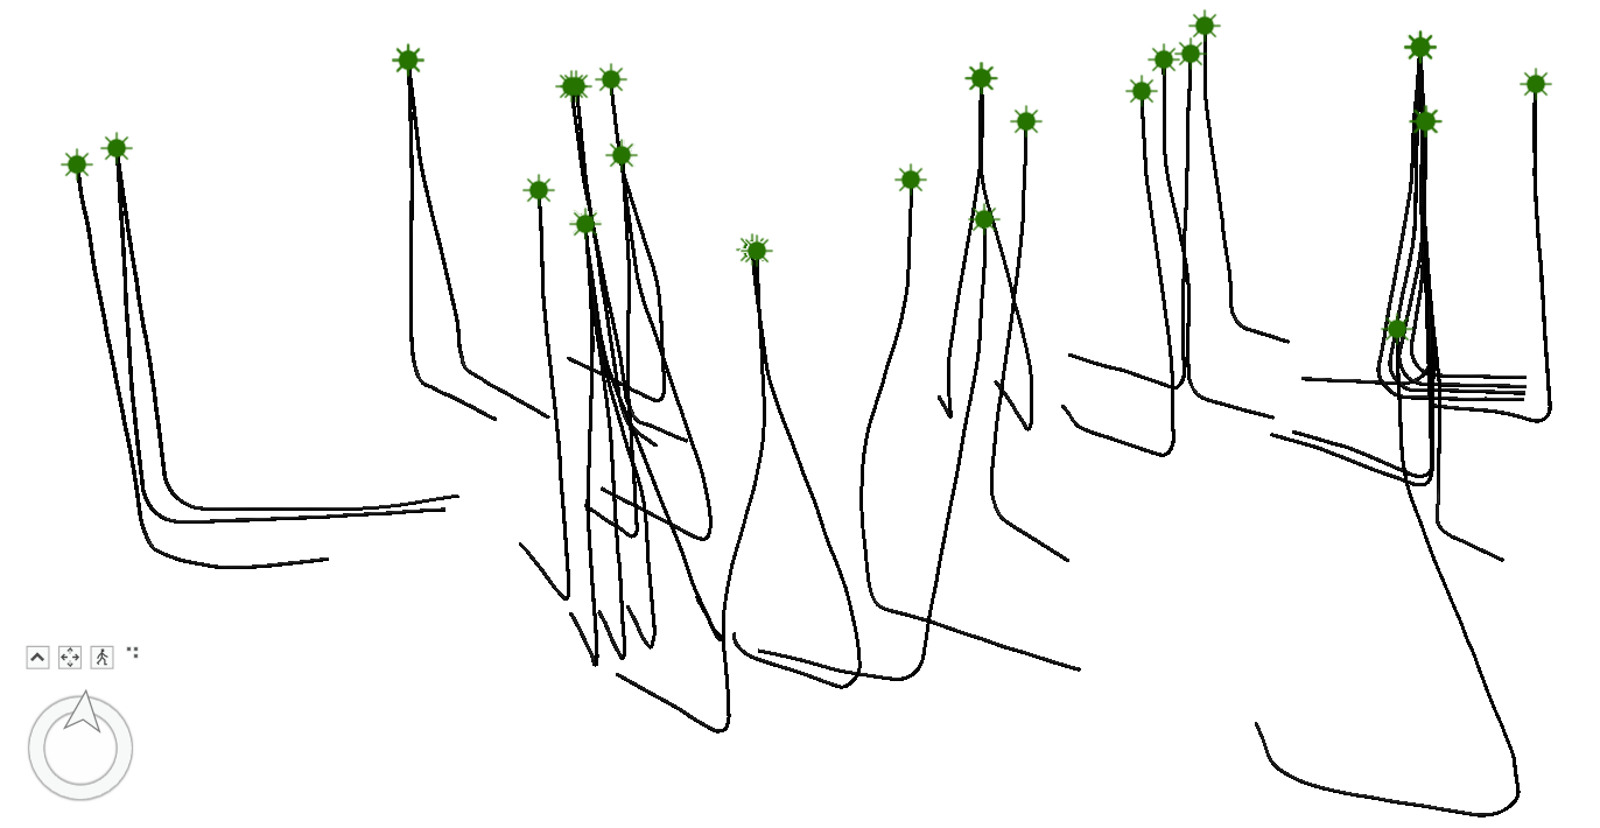
Data Assistant users love our Import Deviation Survey tool, commonly using it to import all their wells to try and get a 3D picture like below. Our existing Import Deviation Survey tool can be batched-up using a python script but we wanted that functionality to be more easily available. So, we’ve extended the Import Deviation Survey tool to have a batch mode that lets you point at multiple wells and import them in all in one go.

This next version of Data Assistant is providing some really unique features that have been sought after for a while, which is why I wanted to create this blog. We think these tools are not only incredibly useful to help with data management – they will also help you create powerful visualisations, making your data and analysis more accessible and easier to understand for all your stakeholders.
Posted by Rich Webb, GIS Software Product Manager, Exprodat


