
In December 2022 the state of California held Pacific Wind, its first offshore wind leasing round. Leases were available both offshore Eureka in northern California and offshore Morro Bay in central California.
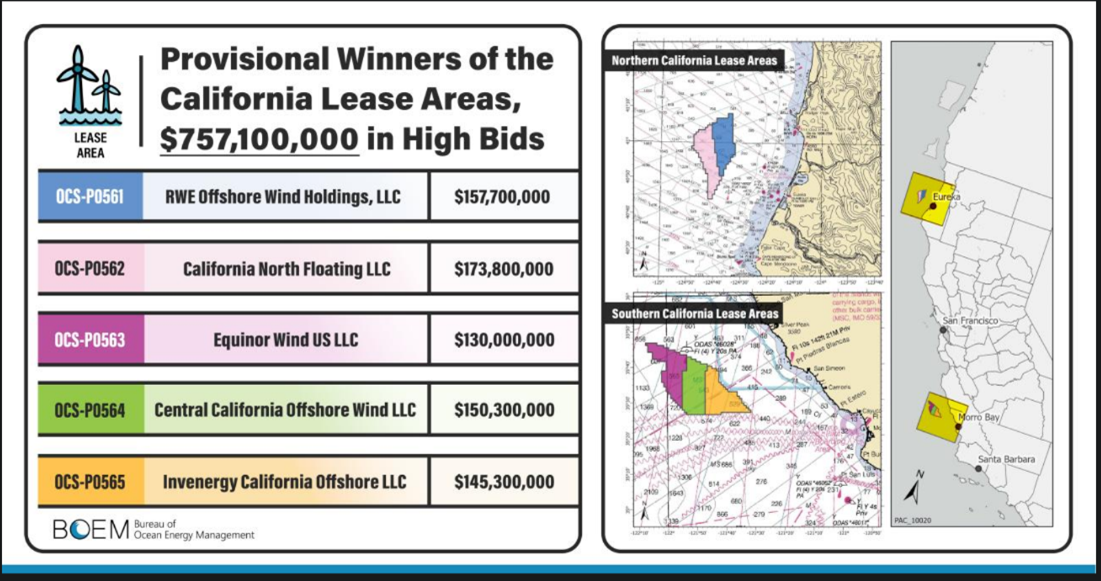
With additional challenges around implementing floating turbines (due to the water depths) and the access to a market, several questions arose that developers may want to answer:
- How many turbines can be placed within the lease areas on offer?
- How much revenue could be generated?
- How many households could be supplied with electricity?
- What kind of carbon offsets could be realised?
These questions are intrinsically linked to the size and shape of the lease in combination with the local wind speed, direction, and fiscal regime. Combining these spatial factors is exactly the type of business problem that GIS – with its capabilities of data integration, visualisation and location analytics – is perfectly placed to solve.
As such, we built a toolbox for analysis wind power using the ArcGIS platform to attempt to easily investigate these questions.
Key workflow
Our toolbox has a simple set of input data:
- A polygon or set of polygons representing the wind leases.
- A wind speed raster (or grid) – we utilized the Global Wind Atlas
From these inputs we’re then able to take some user defined parameters (e.g. Turbine model), some industry standard parameters (e.g. spacing factor), and some location specific parameters (e.g. Household usage by US state) to calculate an array of useful statistics for each lease in a consistent repeatable workflow. This allows legitimate comparisons across different regions.
How many turbines can be placed?
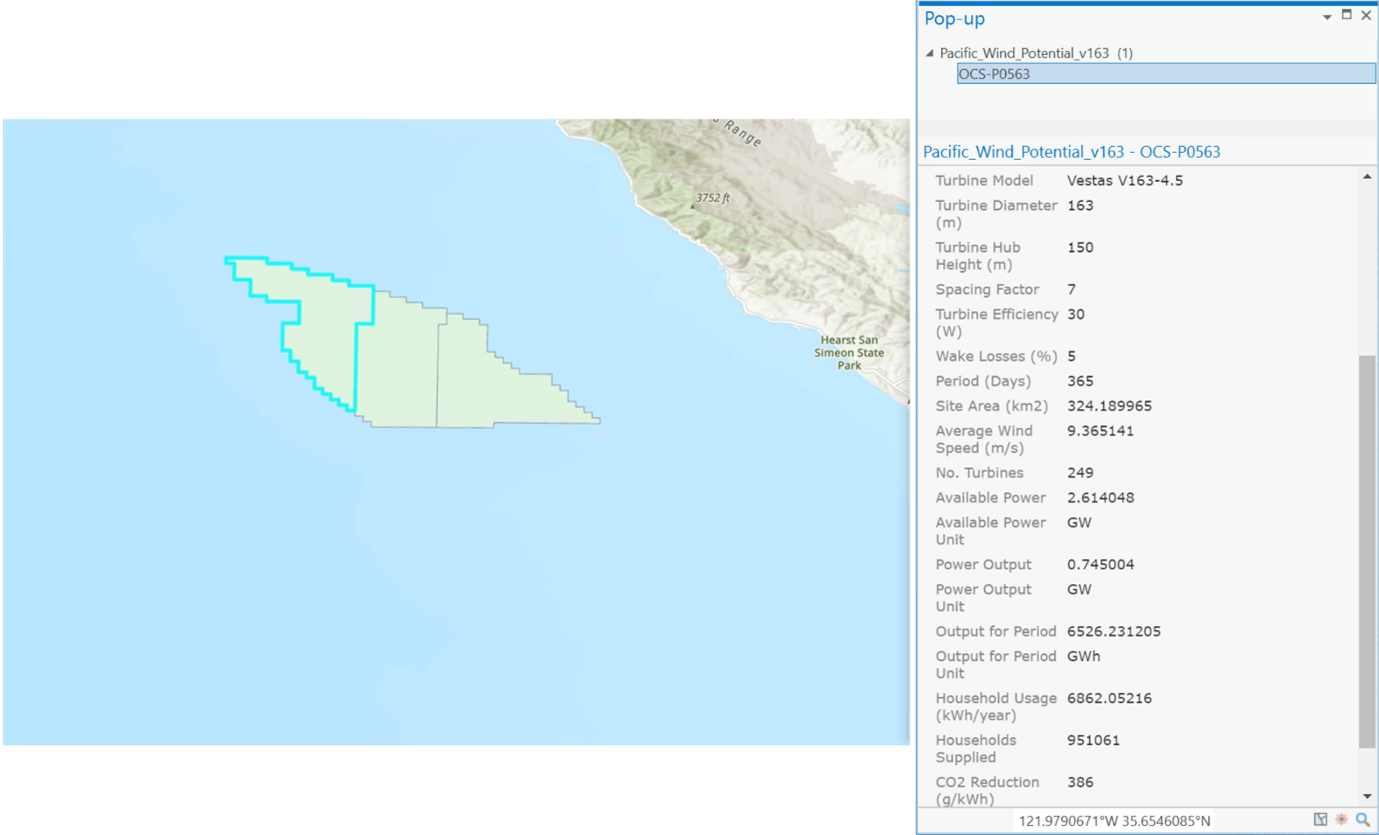
To simplify the process, we decided not to estimate what any potential developers might be planning in terms of maximum wind farm size. Instead, we looked at how many turbines could conceivably fit in the lease based on a standard turbine (we chose the Vestas V163-4.5) and a spacing factor.
This analysis produced the following results for each lease (shown in both table and map views):
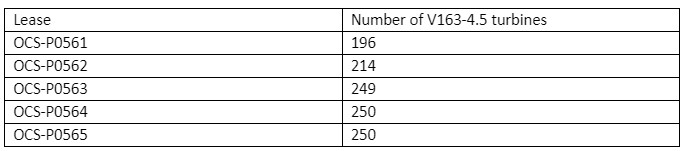
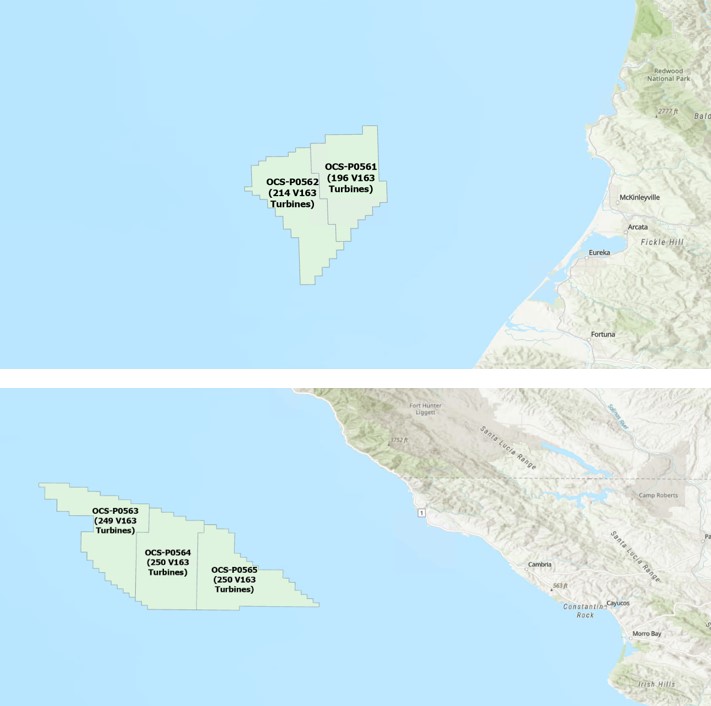
Unsurprisingly, the 3 leases offshore Morro Bay can hold the most turbines (c. 250 per lease), because they are the largest by area. So, presumably the revenue produced by these is highest as well?
How much revenue could be generated?
To estimate potential revenues, we had to make a more complex calculation. We take the wind measurements from the wind speed raster for each lease and combine this with calculations involving the turbine measurements plus efficiency factors, air density, wake losses and so on. This allows us to scale up from turbine power to wind farm power. We then include local factors such as average price of electricity per state from the EIA to calculate potential annual revenue for each lease:
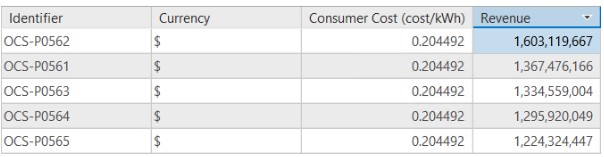
In contrast to the previous analysis on number of turbines, the 2 leases offshore Eureka show the highest revenue figures, because the area’s higher average wind speed compensates for the fewer number of turbines in these leases.
A surprising difference even between close together leases is the over $100 million difference in revenue between the inboard OCS-P0565 lease and the outboard OCS-P0563 lease which have 250 and 249 turbines, respectively. Showing how integrated analysis and thinking can pay off.
How many households could be supplied with electricity?
Region and country specific data can be utilized to produce insight into how many homes could be supplied by a particular wind lease each year.
The EIA again provides statistics around household usage, that we can use to calculate how many households each lease might potentially supply. We could simply look at the number of households in California (13.1 million) and the number of houses these leases could supply (approx. 4.8 million) and say that just over 1/3rd of California could be supplied by these.
As a geospatial company we love maps, so we investigated county level data from the 2020 census and discovered that these leases could supply all the households in particular counties. The map below shows the red counties being supplied by the Eureka wind farms and the blue counties by the Morro Bay wind farms. Large metropolitan areas like Sacramento and Fresno could run on wind power from their own coast!

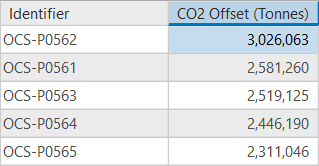
What kind of carbon offsets could be realised?
Moving to renewable sources of energy is required if companies, states and nations are to meet the emissions targets they have set themselves. With that in mind, our toolbox can also calculate how much CO2 might be offset by adding this amount of wind power into the region’s energy mix. Industry standard figures and some country specific data allow us to show that almost 13 million tonnes of CO2 can be offset by these 5 leases each year.
Conclusion
We have seen from the above that a multitude of factors are important in the analysis. Evaluation of the Pacific Wind leases without GIS would be a long and complex a task. Automating the calculations with a GIS toolbox allows you to analyse renewable opportunities in an easy-to-use, repeatable fashion.
If you’d like to learn more about our toolbox or location analytics capabilities, drop us an email on info@exprodat.com.
Posted by Rich Webb, GIS Product Manager.


