There can be times when data which is available to you may not present information exactly as you would like. Variations in units are common. In many cases, you can simply create a new column and calculate a converted value.
What happens when you don’t have write access to the data? Suddenly you have an urgent map to produce but the GIS administrator is snowed under and may not get to modify the data for you in time!
You can use label expressions to build up more complex labels, and this is what we’ll examine in this blog. In this case, I’m taking the example of a selection of fields in the North Sea, which have oil and associated gas production for a 12 month period.
The production units are m3 and ksm3 for oil and gas respectively.
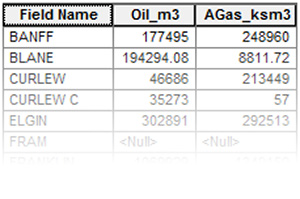
Visualise your labels!
From the start, you should come up with an idea of how you want things to look. Here is the result of a simple label expression which uses several columns.
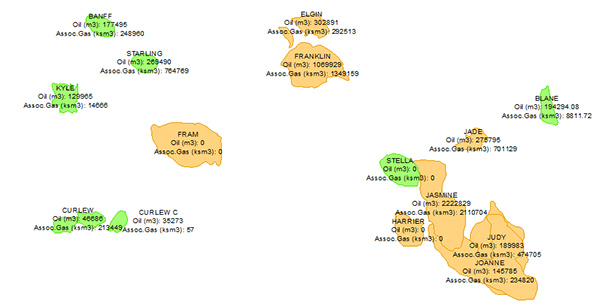
The issues with the labelling in this image are:
- The field names don’t stand out as much as I would like.
- Improvement: Display field names in bold.
- The production units are different, so the units need to be defined, taking up label space. You could always leave the units out of the label and have it mentioned elsewhere on the map. However different units will still be less clear.
- Improvement: Have all values in one unit (MBOE).
- There are fields showing zero production values, taking up more labelling space.
- Improvement: Avoid messy labels where there is no production.
- Improvement: Round all values to 2 decimal places.
- Higher production values I’m interested in don’t jump out of the map.
- Improvement: Highlight gas production above a certain value
To the label dialog…
Firstly, open your Label Expression window (Layer Properties > Labels tab > Expression… button)
Tick on Advanced and select Python for the dropdown. You will see a default function is created called FindLabel.
Next, double click the fields you want to use in the expression.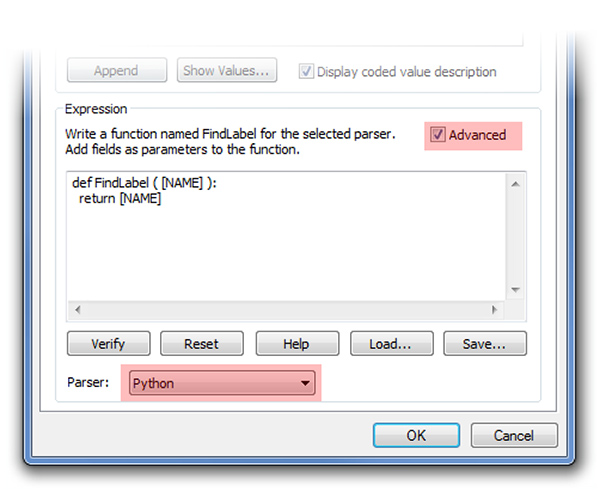
Make sure they are in the brackets of the FindLabel function.
![]()
Start coding
Now it’s time to start writing a bit of Python. The screen grabs here are from IDLE, which allows a clearer view of the code. When the code is in the label expression window, it will not be colour coded.
The basic idea of this is to create a text string, which is returned to the labeling engine. This text string contains the labels and tags to control the final label’s look.
Start by defining a variable for the text, in this case I’ve cunningly called it lab and set it to be empty text:

The first thing to add into the lab variable is the name of the field. To avoid errors, it’s best to use an if statement which will ignore any null NAME values, so these won’t be labelled. While there shouldn’t be any null values for field names, I think it’s best to allow for the possibility. This can also be further extended with an “else” statement to give a big red error label if a field name is in fact null.
As well as adding the name of the field, you can also control the font. In this case, the tag is used to make the field name bold. See the ArcGIS help info on formatting tags in ArcGIS.
Once the field name has been taken care of, it’s time to add in some production information. Oil is the first one to be added in this example.

Several things are happening there. For one, you want to make sure there are no nulls. These can cause errors when trying to calculate the values. As well as that, this is where the 0 values will be stripped out. Remember that criteria where the labels should have no 0 values displaying.
Once the “if” statement is complete, the code moves on to the calculation which converts the units from m3 to MBOE. Note how the Oil_m3 value is forced into a float value, which is stored in variable o. In calculations, if the input is an integer, you can lose data as the result can end up as integer also.
The final step for the oil value, is to add it into the lab text variable. It’s at this step the number of decimal places are defined. The syntax “%.2f” % o is the code which takes care of this, formatting the value of the variable o. The 2f represents 2 decimal places.
More ifs
The last value to be added is the gas. As you can see this is very similar to what is happening with the oil.

The one major difference here is the code has a nested if / else statement which tells the label to be bold and coloured blue if the MBOE value is greater than 4000.
Finally, the label text needs to be returned from Python to ArcGIS – the syntax for that is:
![]()
Bringing the whole expression together, it should look like this. (Note: Extra “if” statement to label No Production)
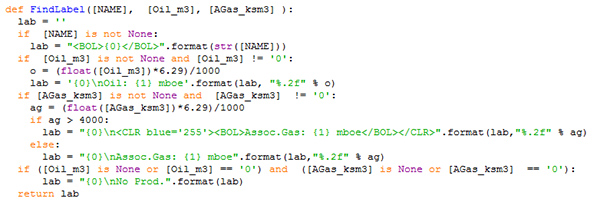
Remember to keep the indentations in line. Python isn’t very forgiving if you fail to do this and the label expression window won’t automatically indent. It’s often useful to copy the code out to a Python IDE to check indents. As mentioned, I used the default IDE (IDLE) for screenshots here.
The result
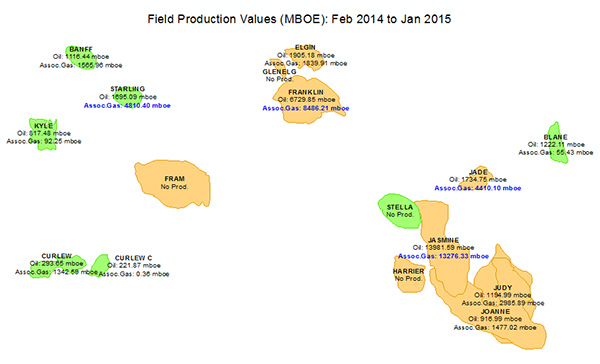
Note how the fields with no production have a No Prod label. This gives a much tidier presentation than multiple lines with zero values.
Posted by Ben Holmes, GIS Consultant, Exprodat.
Data Source: DECC
- https://www.gov.uk/oil-and-gas-offshore-maps-and-gis-shapefiles
- https://www.gov.uk/oil-and-gas-uk-field-data
Learning Python
- ArcGIS specific: http://esripress.esri.com/display/index.cfm?fuseaction=display&websiteID=276&moduleID=0
- Generic: https://wiki.python.org/moin/BeginnersGuide


