Benchmarking GIS Performance: A Multi-client Example
In this blog, which follows a previous posting where I described a GIS Strategy Review Approach for the petroleum industry I’m going to look at a real world example of measuring GIS effectiveness: Exprodat’s multi-client GIS benchmarking project from 2012.
 What is benchmarking?
Benchmarking is the process of comparing one’s business processes and performance metrics with internal best practices and/or best practices from other companies or industries. This allows companies to assess the effectiveness of their systems and processes, identify areas that need improvement and understand best practices in those areas. Internal benchmarking limits a company’s ability to improve. The real value of benchmarking comes through comparison with peer companies within a particular industry.
The project
Exprodat brought together a ‘benchmarking club’ from within its existing client base to test the value of the benchmarking approach and to validate and refine Exprodat’s current benchmarking approach based on our GIS Maturity Matrix model. Twelve companies and affiliates participated, ranging from national oil companies to smaller independents. Information was gathered via web-based questionnaires, and participants remained anonymous.
The results
Overall, most participants fall within maturity stage 2 (Recognising) to 3 (Defining) on the maturity matrix scale. Two participants are close to stage 4 (Managing). The key findings for each maturity category are summarised below:
1. Awareness and governance: average category stage level 2.7
• Although there are reasonable levels of business and user awareness of GIS, it is generally not recognised as a distinct business function. This may change as awareness and use grow.
• The majority of GIS budgets are allocated to support and spatial data purchase. Most participants don’t measure return on investment on GIS project spend.
2. Use of GIS: average category stage level 3.1
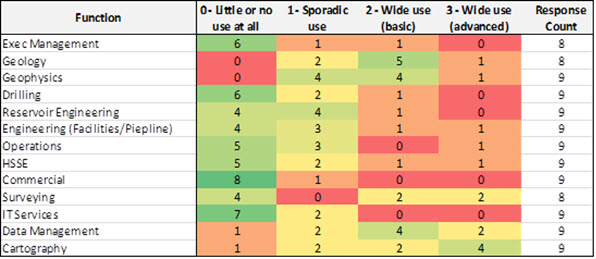
• In terms of GIS use, there are two sets of participants:
o A set of companies that have relatively limited use within a particular business function (usually Geosciences), supporting a small number of key workflows (usually Exploration-based eg play mapping).
o A second group that use GIS across a number of functions, supporting a variety of workflows. These also tend to be the larger participants.

• There appears to be potential for significant growth in GIS, particularly in the Geosciences and Facilities Engineering.
3. Spatial data management and integration: average category stage level 2.8
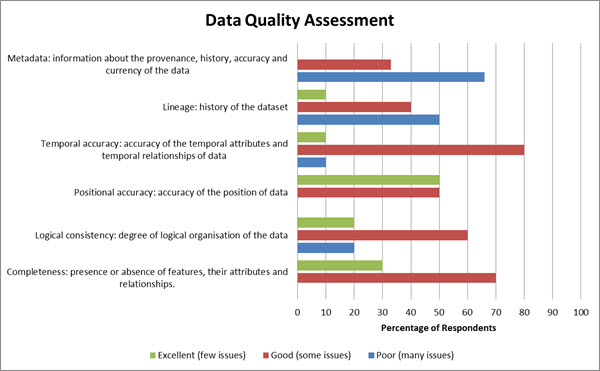
• Most companies are still at a relatively immature stage in spatial data management, with issues around data quality and standards (particularly metadata and data lineage). This potentially impacts the discovery and re-use of spatial data.

• A smaller group of participants have recognised the need for dedicated spatial data management systems and processes, and have made significant progress in this area.
• Data storage volumes are relatively low compared to other E&P data types. However, the large number and variety of spatial data files introduces a high level of complexity around spatial data management and represents a significant challenge for many companies.
• A number of other E&P applications generate and consume spatial data, requiring a range of integration technologies and processes.
• The most commonly used data types are Administrative, Geoscience, Drilling and Engineering. Environmental, Geomatics and Hydrography data show an approximately equal split between current use and potential future use. There is a significant demand for potential future use of Health & Safety, Imagery and Topography data types.
4. GIS technology: average category stage level 2.9
• GIS is increasingly recognised as a core application, and larger participants are starting to put standard GIS architectures in place, including enterprise licensing agreements and standard upgrade policies.
• There is an even distribution of desktop and web/mobile GIS deployment. Most participants have, or plan to, introduce web and/or mobile GIS capability to expand the reach of GIS in their organisations.
• Most participants carry out some form of development/customisation, and generally use external providers to support this.
5. GIS Support: average category stage level 2.4
• Most participants have some form of dedicated GIS support that generally reports through another technical support function in the organisation (eg IT, data management). This is provided by a combination of in-house staff and external support providers.
• A range of common support issues were identified: unstable IT environments, integration with other applications, data quality and availability, software complexity, lack of common workflows and lack of training.
• Support quality is rarely measured, and very few participants have a structured career path for internal GIS staff.
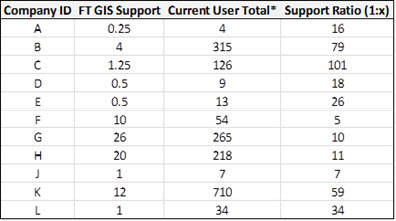
• Support ratios vary widely between participants (between 1:5 and 1:100, averaging 1:33). These are influenced by large numbers of web-based GIS users in some companies.

6. GIS training and communications: average category stage level 2.2
• The majority of participants have no formal staff GIS training programme in place, relying on ad-hoc internal/external training. GIS training accounts for less than 4% of overall GIS budgets.
• Few business users attend GIS conferences or user group events. There is wide variation in user participation in internal events (eg special interest groups).
In summary
The GIS Maturity Matrix model proved to be an extremely effective framework for benchmarking and comparing GIS implementations in our benchmarking group. The next step is to expand the benchmarking group, and to re-run the analysis so that the original participants can internally benchmark their progress. We also want to bring the group together to share best practices and identify areas they might work on together to improve.
If you’d like to get involved in the next phase please let us know.
Posted by Gareth Smith, Managing Director, Exprodat.


