In the next of our blogs on Building a Digital Twin within the ArcGIS Platform, we start to look at options for creating 3D models using point cloud data. The data we used was a point cloud of our offices that we collected using a Drone and a Laser scanner.
Missed the early instalments of the series? Check out Part 1, Part 2, Part 3 and Part 4 first.
Introduction
To re-cap, at the end Part 4, we had created a merged point cloud for our London office and had uploaded a thinned version to ArcGIS Online (see here). We ran the same processing on the data from our Leeds office and used that to generate this basic fly-through, which we’ll look at finessing in a future blog.
In this instalment and our next blog we’ll look at ways of modelling the features captured by the point cloud to achieve a range of aims, from the creation of a simple floorplan to the capture of the fine detail of ceiling mouldings and wall panels.
Why model?
The point clouds are pretty remarkable – they can be symbolized using the point elevation, the captured RGB colour or the captured intensity; can be classified and filtered, and can be thinned dramatically but still be of use. Arguably, however, they have a couple of issues that prevent their being directly used as the base data for our Digital Twin:
- They’re all holes
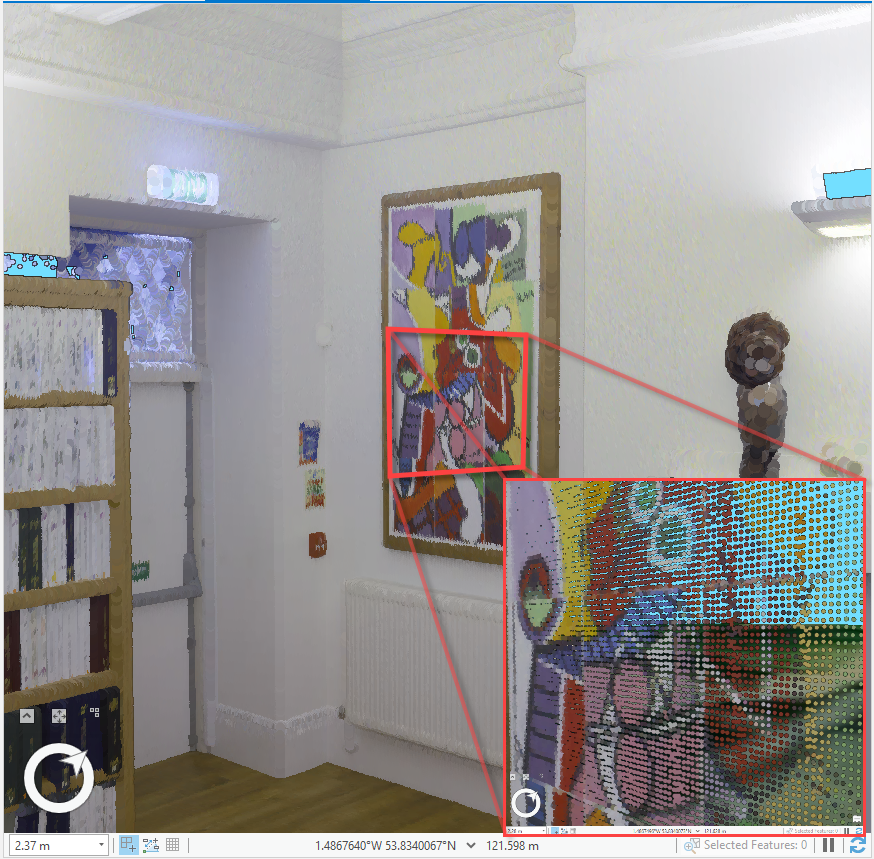
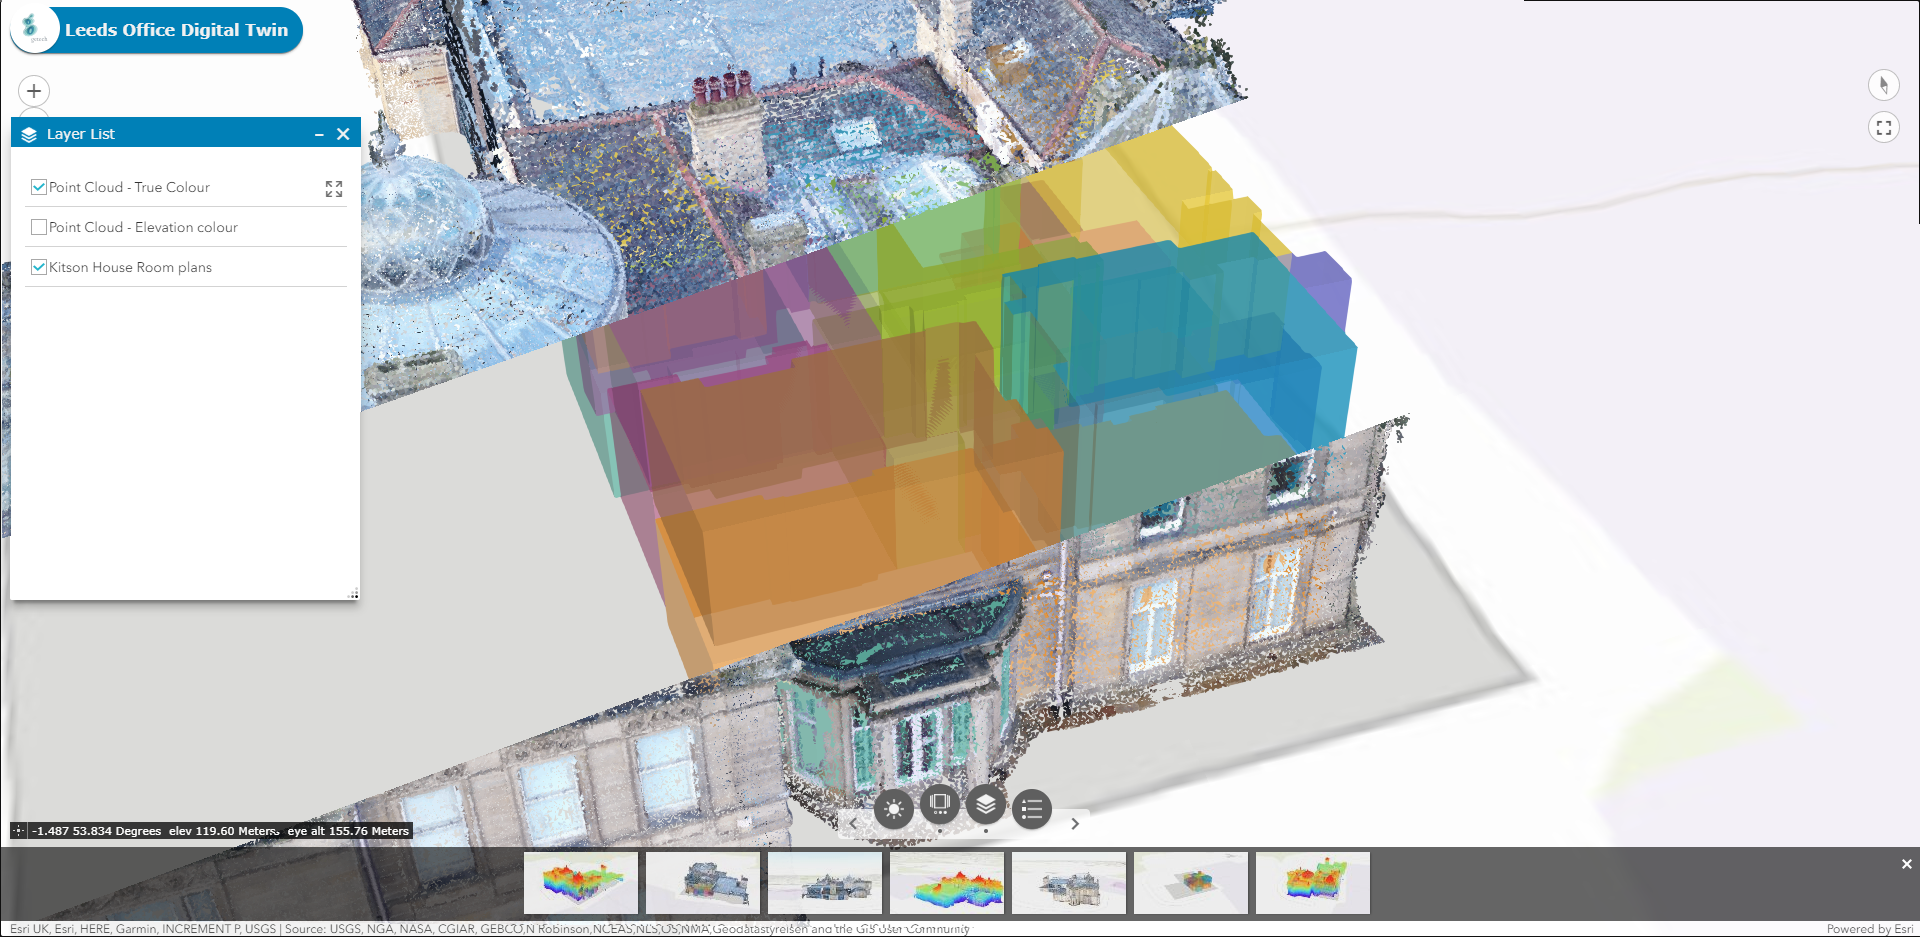
The points are all separated by gaps – they may appear to make solid walls, but zoom in, and you’ll find yourself looking at the whatever’s behind the wall (see inset in screenshot below).
- The points are all effectively unrelated to one another
Whilst you can classify the points, you can’t define which ones are related to which other ones – e.g. which of the points make up the painting you’ve captured on the wall in one of your scans.
What we’d like for our Digital Twin is something with features in it, that we could click on and associate attributes with, so that we could ‘do stuff with it’ – at the most basic level, we’d like to define rooms but moving on from that, we might want to do things like defining the artist for a painting, link it to a purchase record, etc. More prosaically, but perhaps more usefully, we might note the location, type and servicing information for our fire prevention equipment. To achieve this we need to work out how to model (make) those features from the point cloud. As suggested in the introduction, let’s start with a simple floorplan.
Creating a floorplan
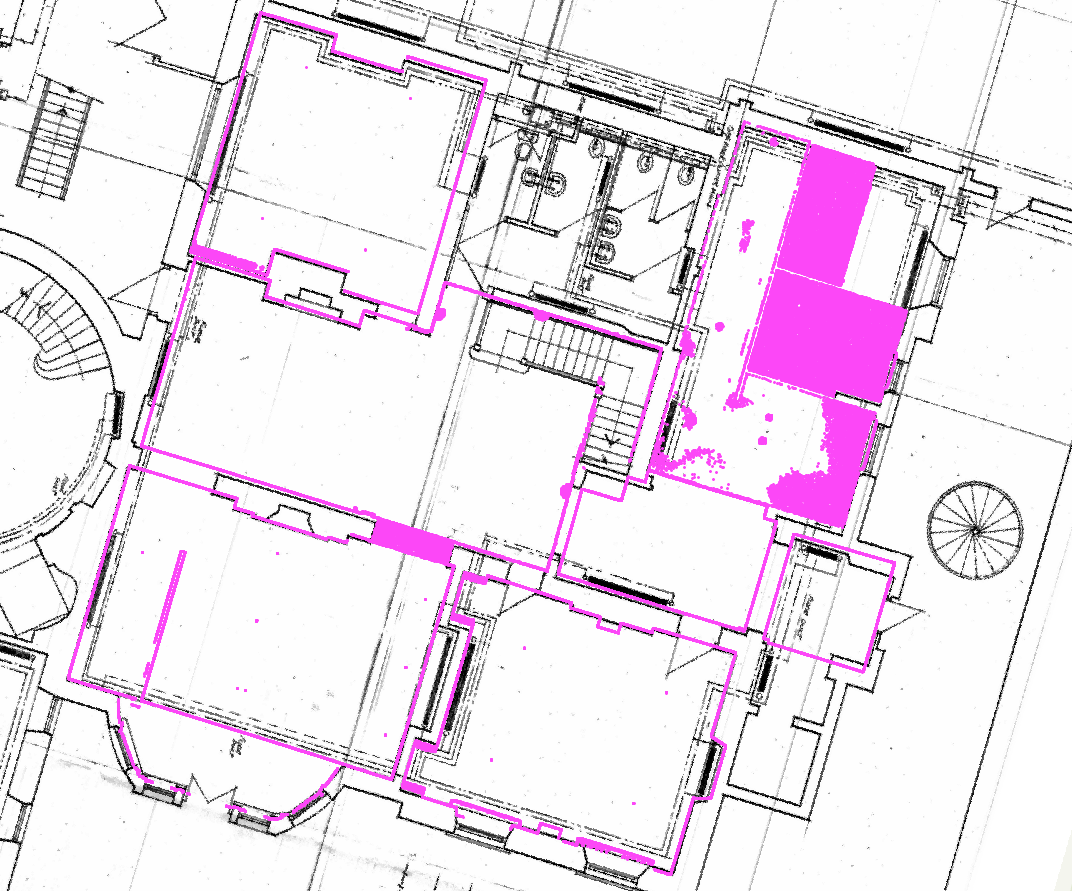
The floorplans for both our offices were pretty good, when georeferenced and compared with the point cloud (see below and also blog 4).
Slicing a point cloud
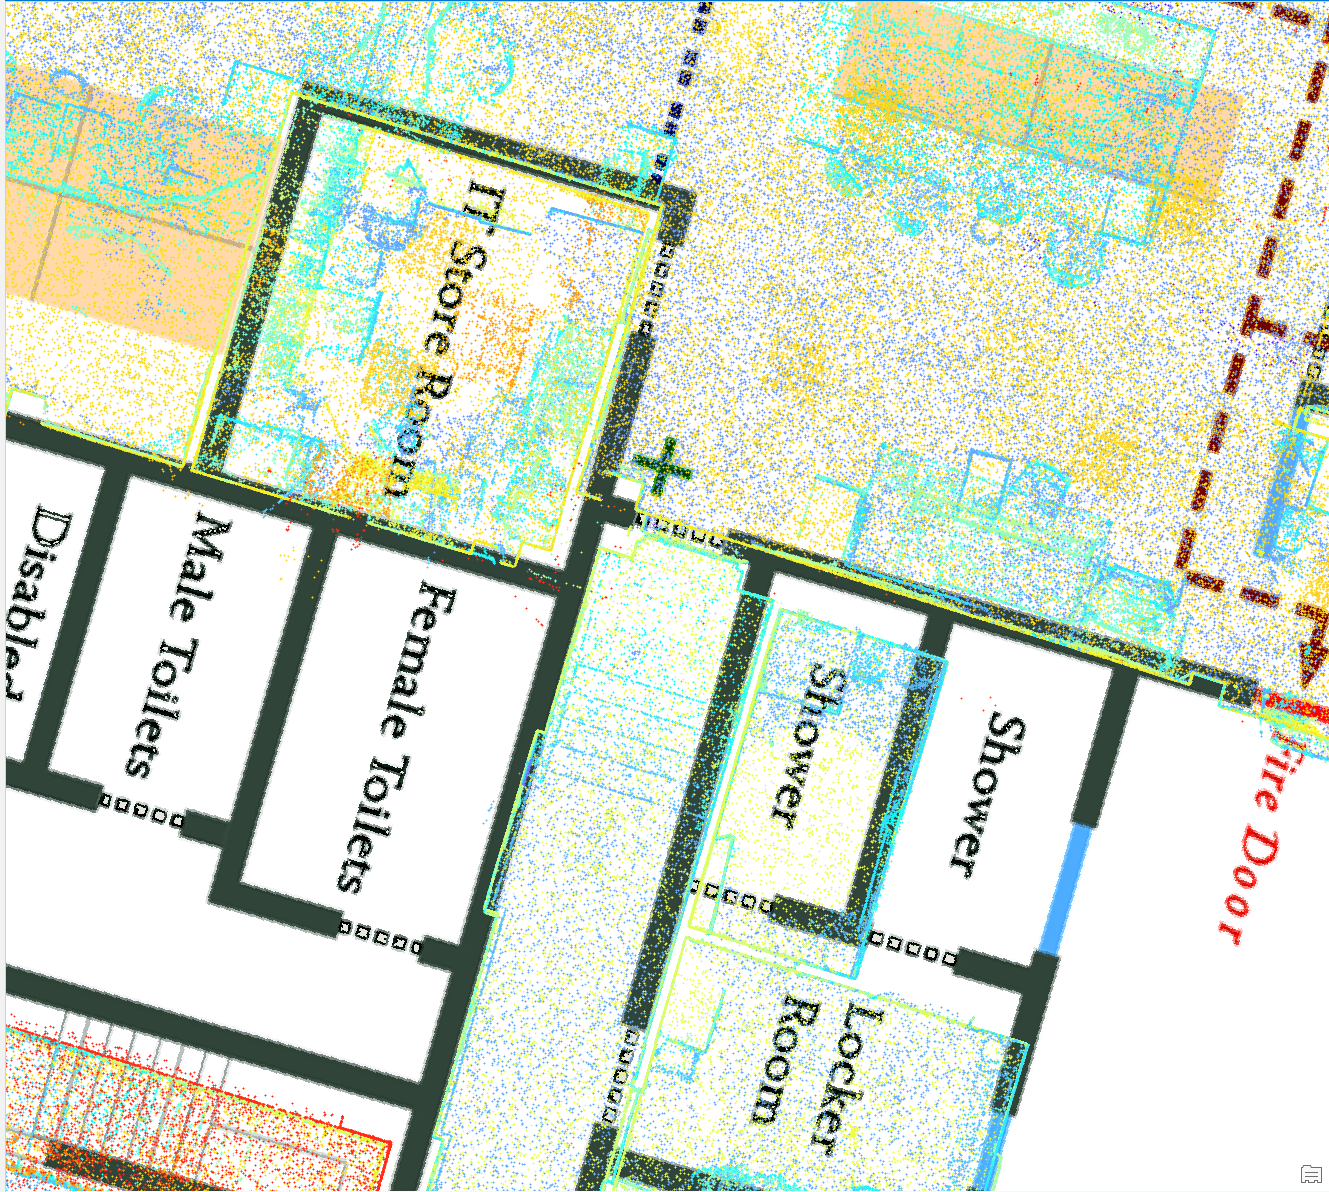
If we take a thin slice through our point cloud at just above head height (which was more difficult than it sounds, and required that we write a Python script using the LASPY library) , we get something that looks like a floorplan:
Density maps
We also experimented with creating density maps of the point clouds, which is interesting and should assist our future efforts to semi-automate the extraction of structural features. It has to be said, it takes a very long time to create them, even if you use thinned versions to identify the densest areas and then process only those. The LAS Point Statistics By Area tool in 3D Analyst can assist in generating density maps.
Extrude those lines
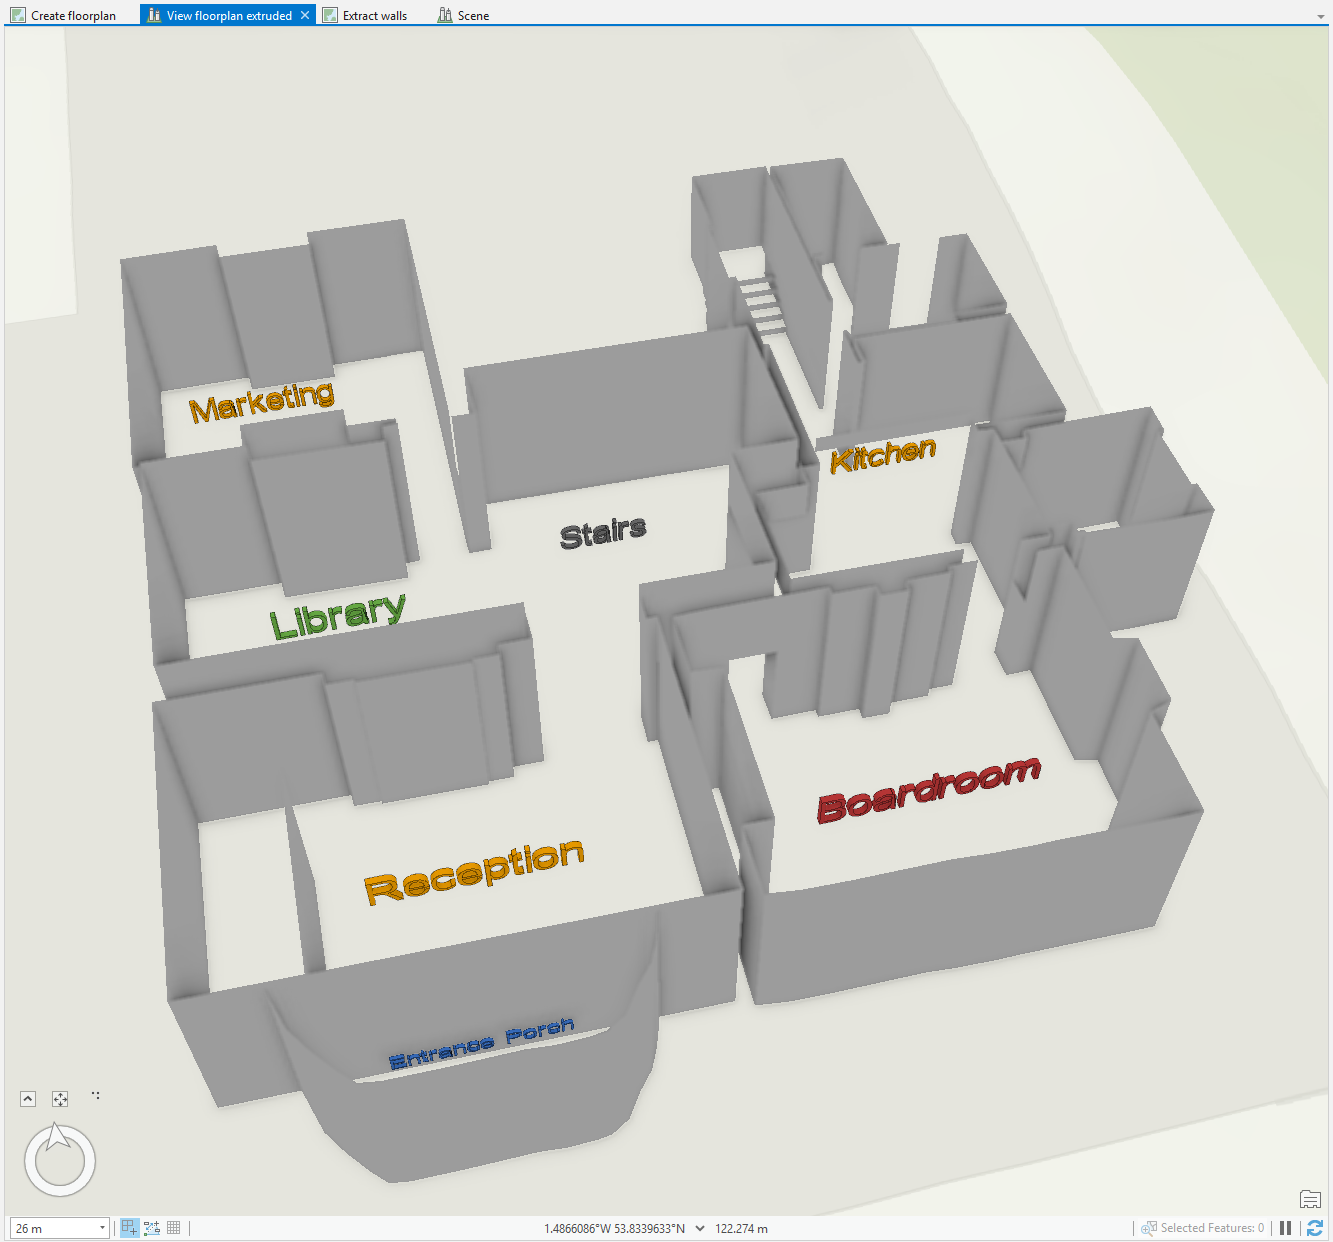
Digitizing the lines off the sliced version produced an accurate georeferenced 2D floorplan; adding some Z information allowed us to extrude the lines in Pro and create a basic 3D model:
We made rudimentary openings and stairs by defining an above-floor-level minimum Z-value for a line and then extruding the line vertically from that base height using a value stored in an attribute field – retrieving all the Z-values from the point cloud, by just clicking on it.
Once we’d done that, we used the Layer 3D to Feature Class tool in 3D Analyst to convert our extruded lines into multipatches, which were then edited to create windows and other architectural features. The 3D editing tools in ArcGIS Pro are remarkably powerful, but I’d have to confess to have run out of patience when attempting to master using them against point clouds and multipatches, so I decided to park that learning curve and look at lazier options, as I’ll describe in the next blog.
In order to round out our basic model, we converted the wall line work to polygons (using Feature to Polygon, which I now note requires an Advanced license of Pro) and closed off areas to create rooms.
With the addition of z-values as attributes, we used the Feature to 3D By Attribute 3D Analyst tool to create floor and ceiling 3D feature classes, which we converted to multipatch and then merged with the walls, having added appropriate attributes to allow us to filter the result, e.g. to only display a particular room, or to hide particular structural features such as ceilings. We then repeated the effort for the first floor, and published the overall merge to ArcGIS Online, where you’re welcome to take a look [Kitson House Rooms].
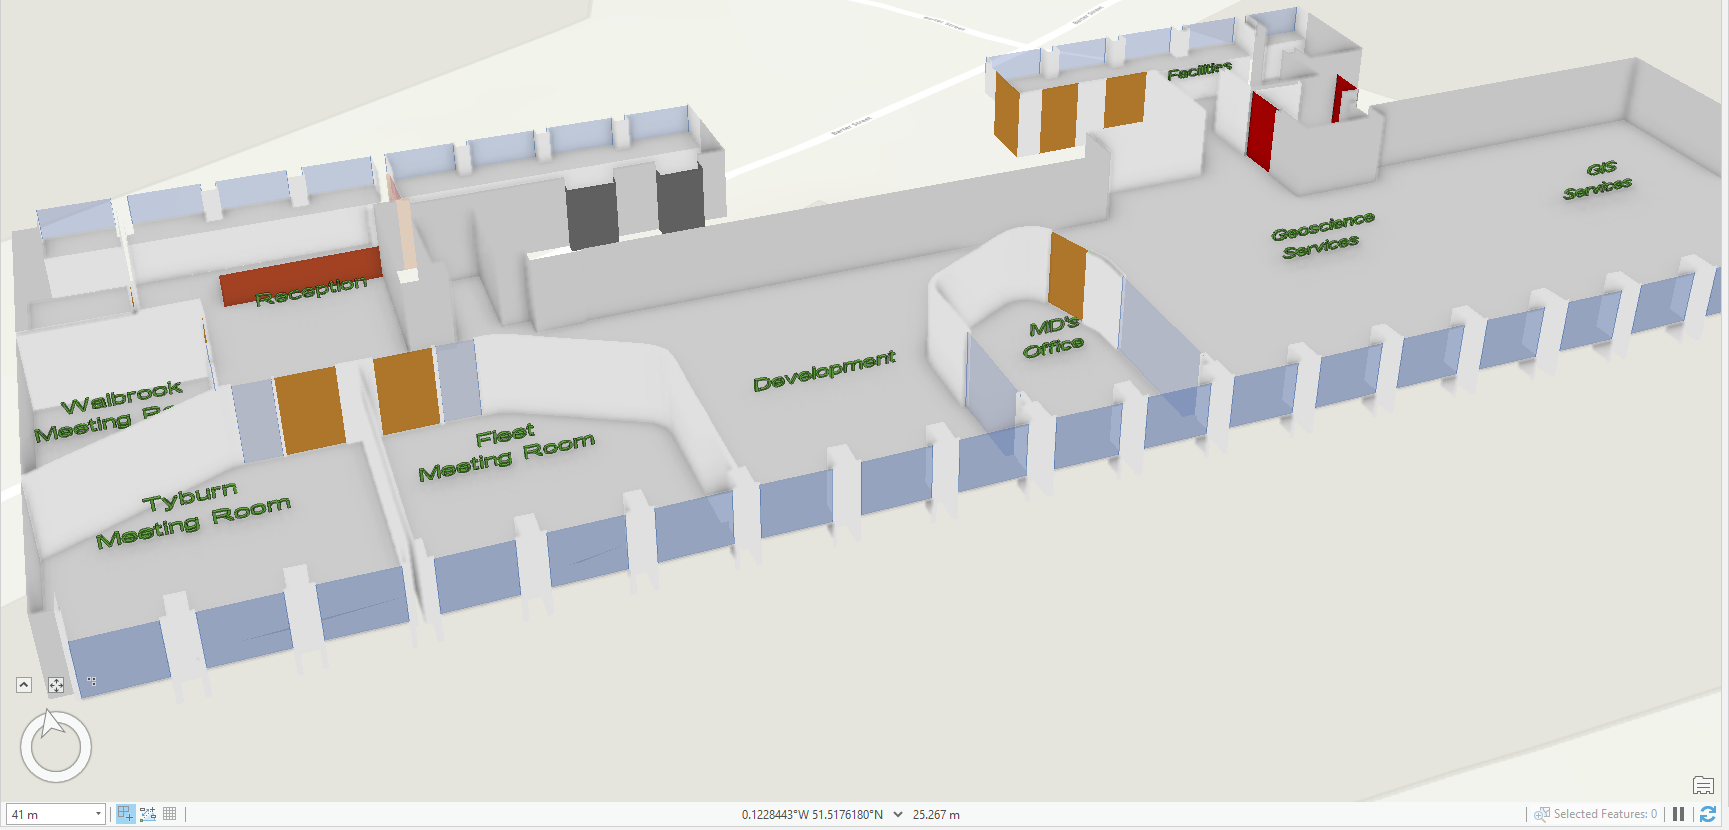
We did the same for our London office, and in a few hours had quite a pleasing model, with transparent windows:
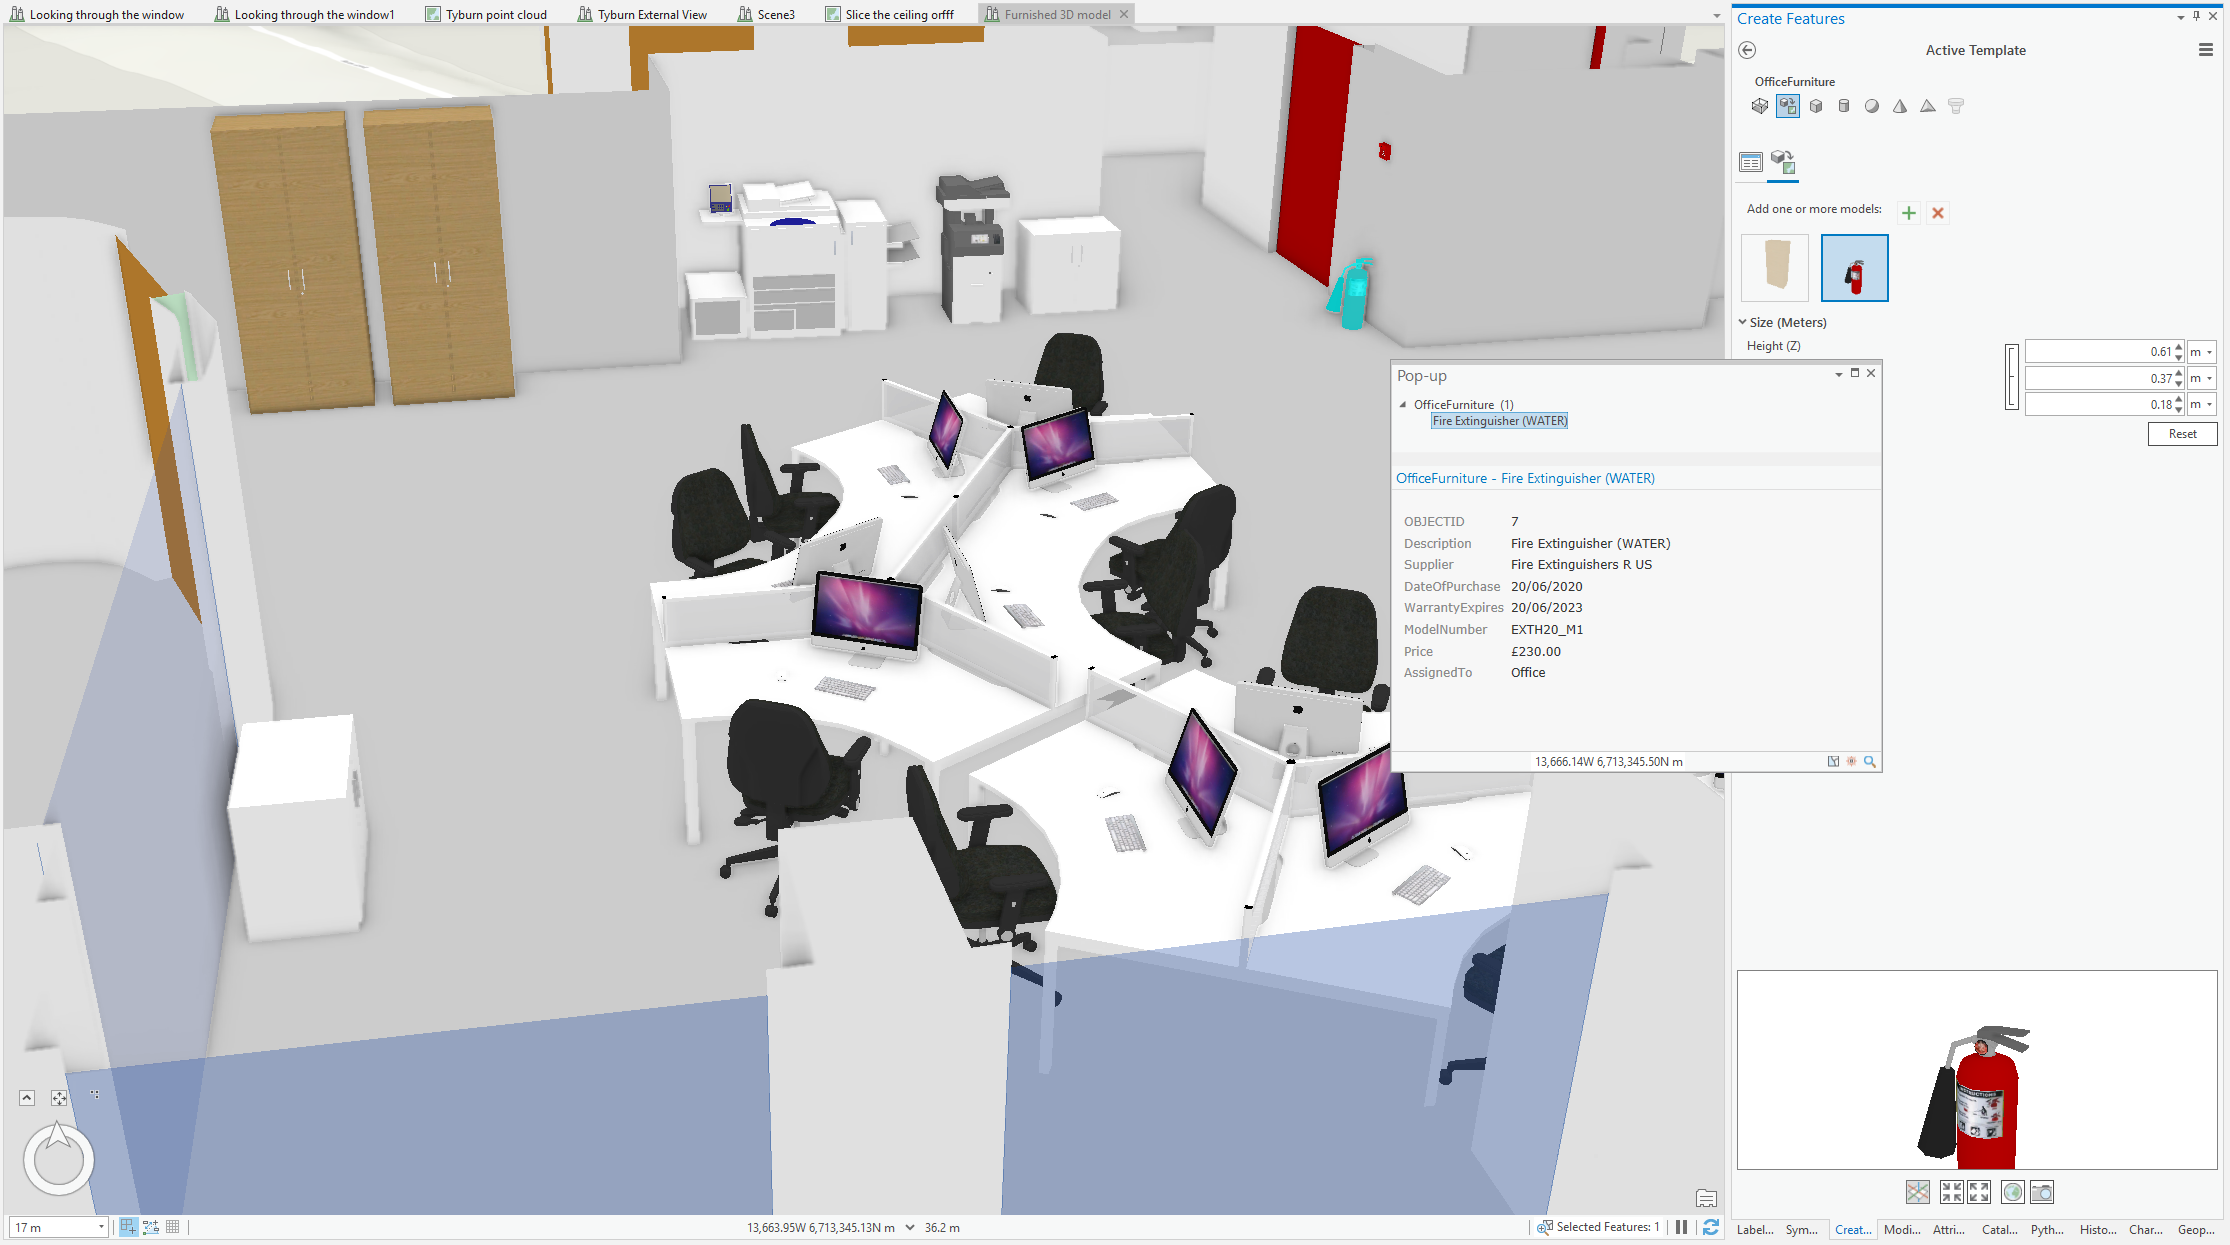
With the addition of some COLLADA models (see below for the sources) from the SketchUp 3D Warehouse (added to a multipatch using ArcGIS Pro), we produced a furnished Digital Twin to which we can add asset information:
In the next blog we look at ways in which we can create more detailed models from the laser scan and drone data, but what we created above is actually pretty usable as a base for adding asset or state information, as illustrated. Also, as we will see, simpler models have a huge advantage over detailed ones – they don’t eat all the memory on your machine.
Lessons learned:
- Density mapping is useful but processor-intensive and therefore time-consuming. However, it potentially offers, if done in 3D (as ‘voxels’), the ability to retrieve structural components as separable features.
- It’s straightforward and fast to create a usable and attractive model within ArcGIS Pro from a point cloud – the point cloud proves its worth by allowing measurements to be easily and accurately obtained. Achieving the same level of detail and accuracy with a tape measure (or laser measure) is challenging and time-consuming.
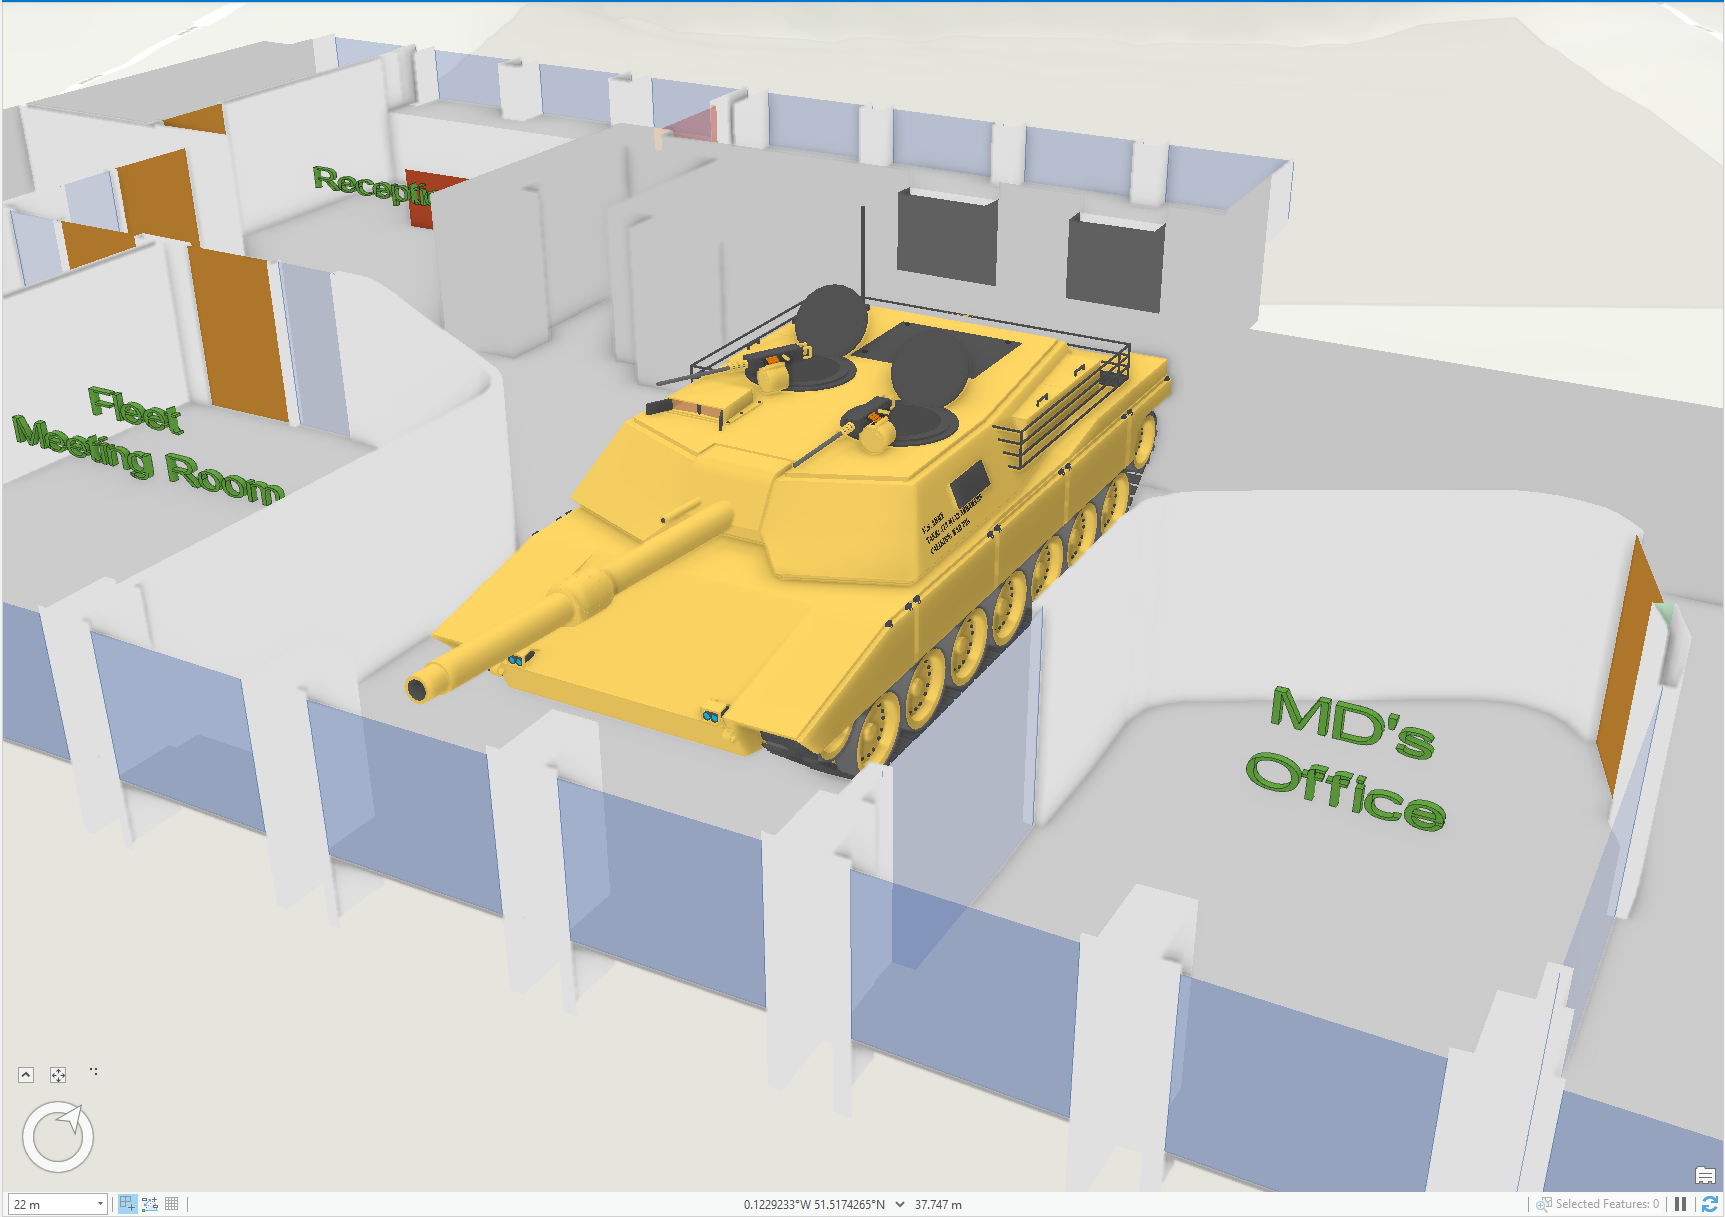
- Having an accurate model of your working environment allows you to answer questions that otherwise might require costly experimentation – such as whether-or-not you could fit a tank in – the answer in our case is yes, but it’d need some silky-smooth steering skills (and a few walls removed):
Posted by Ross Smail, Head of Innovation.
- Office furniture models from Gresham Office Furniture
- Extinguisher from Tom N
- Fire alarm from Oliver A
- Tank from Kristian B
We’ve not published these to our ArcGIS Online as it appears to be ‘impermissible aggregation’, according to the 3D Warehouse FAQ, but you can use them internally, it seems.
