I want to create a complex custom symbol for use with area fills on a map. In ArcMap this can be done either with a multiple stacked marker symbol which is time consuming and difficult to construct, or using a small bitmap and importing that as a picture symbol. The problem with picture symbols is that they can appear blocky, especially when plotting.
After some investigation I found that there is a better way – to create a cartographic representation. Two things make this ideal: there is a convenient and easy editing interface available (the Marker Symbol Creator) for creating complex symbols and the flexibility of the representation rules can be used for effectively displaying it.
Note an ArcEditor or ArcInfo licence is needed to create cartographic representations, but they can be used with an ArcView licence. They do not replace layer files or traditional style files, but should be considered to be an addition to them.
Creating a new representation using the Marker Symbol Creator
First create a feature geodatabase (GDB) and create or add a dataset. You’ll need some example points, lines and polygon layers for this. In ArcMap, load the dataset then right click on it and select “Convert Symbology to Representation…”
Several options are provided within the “Convert Symbology to Representation” dialogue but just keep the defaults. This conversion creates a duplicate of the layer in the TOC.
When the “Layer Properties” dialogue is opened for the representation, an additional option exists on the “Symbology” tab – Representations. This is where the rule is applied to the representation. To create a new marker pattern just click on the “Add new marker layer” button. This populates the central panel on the dialogue. Clicking on the green point symbol at the top opens the “Representation Marker Selector”.
Clicking on the “Properties” button opens the “Marker Editor” interface.This allows full editing of the symbol just like a graphics package. Delete the existing spot and create your own symbol using the available tools of the interface. Within five minutes you can create your own custom symbol of an oil derrick:
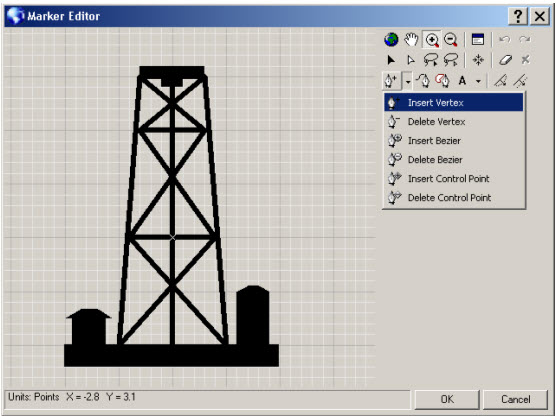
Name this symbol ‘Oil Derrick’ instead of ‘Rule 1’, then make a second symbol called ‘Nodding Donkey’. To do this click on the “Create New Rule” button and follow the same process. The nodding donkey symbol is a bit more complex, but should only take 10 minutes to construct.
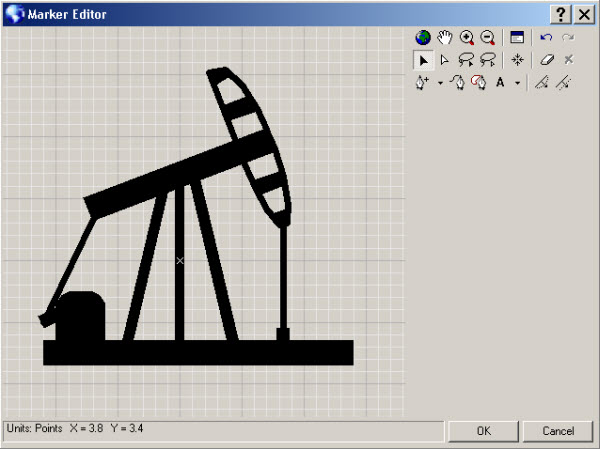
Save these as representation symbols by clicking on the “Save” button from the “Representation Marker Selector” dialogue. Note these are saved within the ‘Representation Rules’ part of the user style file as can be seen in the “Style Manager”. They can be copied within the “Style Manager” to a standard company symbology style file as ‘Representation Rules’ for use with other projects.
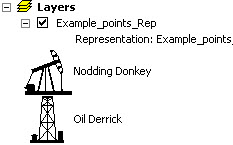
Now you should have two symbols that can be used as a “pattern” on a polygon.
Using a marker symbol on a coloured area fill
After creating the new complex marker symbol you can use it in an area fill pattern. First you need to convert your polygon to a cartographic representation.
Open up the “Layer Properties” dialogue for the new representation and edit the ‘Rule 1’ with the “Add New Marker Layer” button. Note you could have imported a symbol from an existing style at this stage.
Next click on the black marker symbol to open the “Representation Marker Selector” (see the red highlight below):
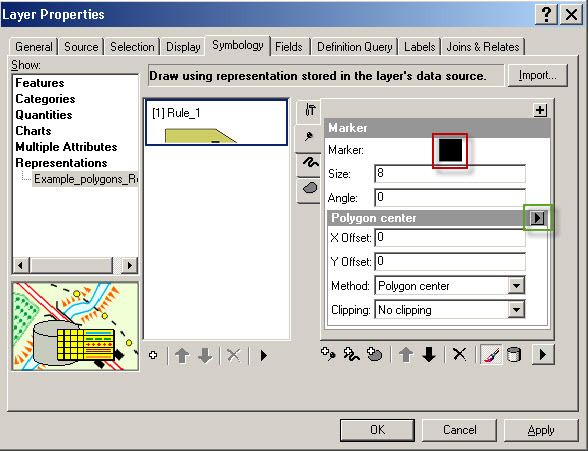
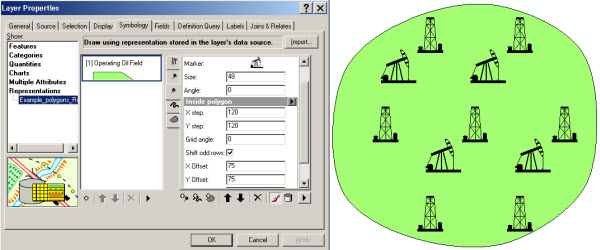
Your new symbols are now available at the bottom of the list. When selected you can then apply some changes to the size, X and Y steps and set the ‘Inside Polygon’ marker placement, by clicking on the drop-down arrow to the right of the ‘Polygon centre’ text on the panel (see the green highlight above).
The ‘Clipping’ is selected as ‘No markers touch boundary’. Note symbols can also be rotated. These symbols line up vertically and horizontally as a default. To stagger the markers check the ‘Shift odd rows’ box.
Can more than one marker symbol be used?
Yes – To do this simply add a second marker symbol using from the “Add New Marker Layer” button. The default will put both symbols on top of each other, so use the X and Y offset on one symbol to separate them and also double the X and Y step for both symbols:
So now you have two high quality custom vector based symbols that can be used as point symbols, or along a line, or distributed within an area fill. Use this technique to givie a more professional look to your cartographic quality for those important maps!
Gavin Adcock, Senior GIS Consultant, Exprodat


