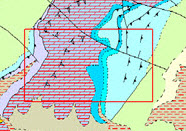
 One of the key features of a GIS is the ability to view spatial data at any scale. To do this you need to understand what information should be displayed at what scale. This understanding is useful both for working within the GIS and for creating usable output, such as hardcopy maps or PDF map books.
When working with geological data, there may be instances where having (selected) detailed information, such as that relating to individual geological units, shown on a regional map is of use, but generally it will be hidden.
It is possible within most GIS applications to set up scale ‘filters’ on selected layers, to enable them to be hidden at certain scales. This capability allows the GIS user to compile data into a single GIS project that can be used at a range of scales, allowing that GIS project to be used for a variety of purposes.
This blog considers what sorts of geological data might be compiled into a GIS project, and at what scales these data might be generally displayed.
Large scale means big, right?
A large scale map is one that shows small areas in detail, e.g. a town plan. Conversely a small scale map shows large areas in less detail, e.g. a world map.
- Large scale = small area
- Small scale = large area
Scale and geological mapping
Small scale geological maps (1:50,000 and smaller) are suitable for researching issues such as the prospectivity of a region, or regional scale structures, e.g. a fold belt.
Intermediate scale geological maps (1:50,000 to 1:5,000) include more detailed information such as the outlines of prospects; regional-scale strike and dips; and larger structural elements that control hydrocarbon accumulations (e.g. individual anticlines).
Large scale maps (1:5,000 and larger) offer details that would crowd-out a map of smaller scale, such as sampling sites, dip and strike markings, small faults, outcrops. These maps are generally used once a prospect has been identified and geologists have been into the field to gather data. Their scale and content are designed to allow the size and shape of a hydrocarbon or mineral body to be defined and understood.
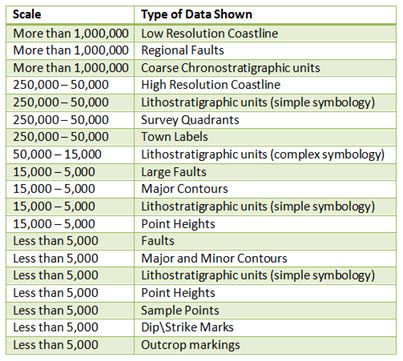
The following table illustrates suggested scale ranges for different types of feature, and the maps which follow it illustrate the effect of applying these scale ranges to the data layers with a single GIS project, and then viewing the project at a range of scales – the rectangle on each map indicates the map area displayed at the next scale.
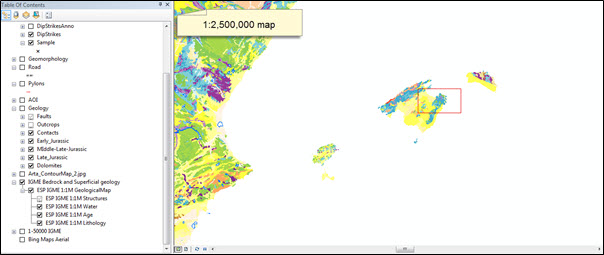
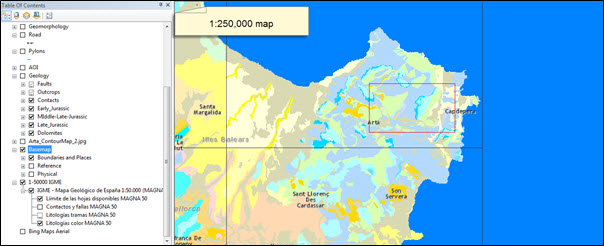
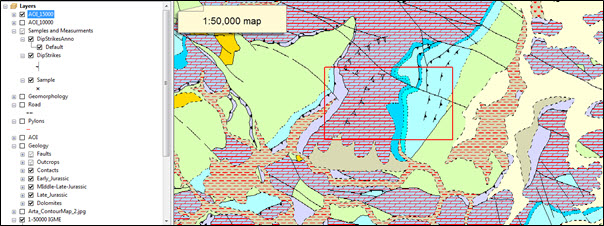
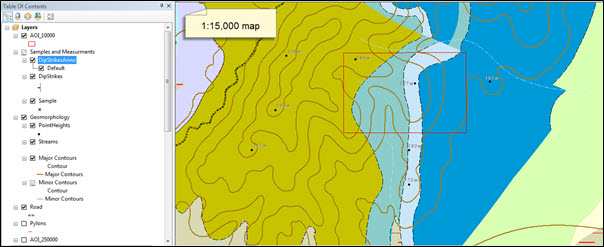
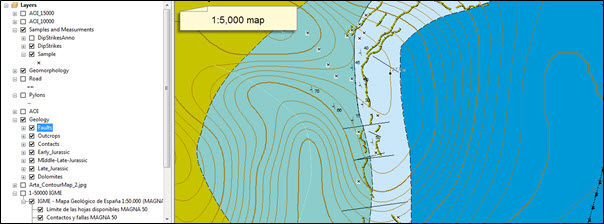
Setting scale dependencies in ArcMap
The maps shown above use the scale dependency functionality in ArcMap to control the layers displayed at each scale. As well as making the display clearer, using scale dependency also generally increases the performance of the map, as less data has to be displayed each time it is refreshed.
To set scale dependencies in ArcMap:
- Right-click the target layer (this can be a group layer) and select Properties.
- Select the General tab in the Properties dialog and find the Scale Range settings at the bottom.
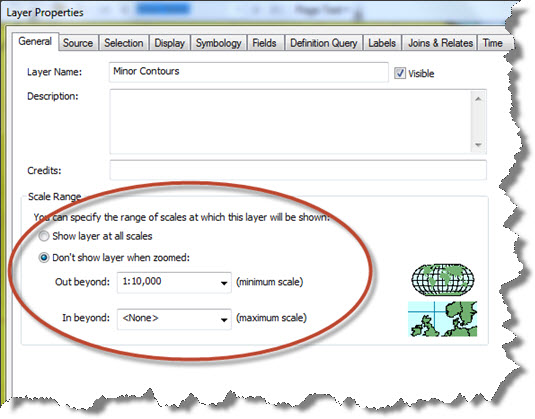
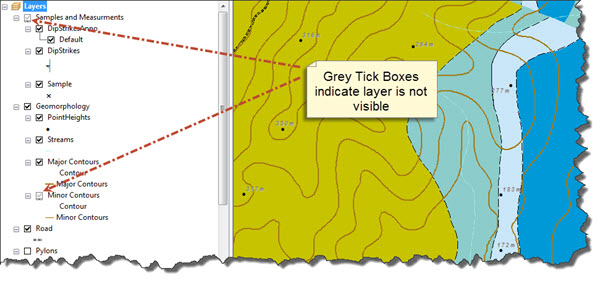
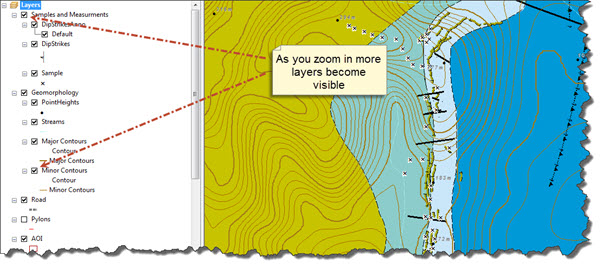
When scale dependencies are defined, layer entries in the Table of Contents for layers that are outside of their defined scale range will be greyed-out, and the layers won’t be visible in the map.
Summary
Understanding how you can use scale dependent rendering not only allows you to manage data effectively but greatly enhances the value of your map. Controlling what data is shown at what scale enables you to tailor your map for your audience, as well as improve performance.
Posted by Simon Kettle, GIS Consultant, Exprodat.
References
Instituto Geológico y Minero de España, 2013. Mapa geológico de la Península Ibérica, Baleares y Canarias a escala 1/1.000.000 (WMS) http://mapas.igme.es/gis/services/Cartografia_Geologica/IGME_Geologico_1M/MapServer/WMSServer
Instituto Geológico y Minero de España, 2013. Mapa Geológico de España a escala 1/50.000 (WMS) http://mapas.igme.es/gis/services/Cartografia_Geologica/IGME_MAGNA_50/MapServer/WMSServer
Kettle, S., 2012. Resedimented carbonates from the Jurassic of Mallorca. M.Phil. thesis, University of Birmingham.


