
Exploratory 3D Analysis Elevation Profile
In our previous blog, we looked at existing methods for creating elevations profiles in ArcGIS Pro. Here, we look at a method new to ArcGIS Pro 2.7 – Exploratory 3D Analysis, which includes the interactive Elevation Profile tool.
Unlike the Ready-To-Use tool, Exploratory Analysis does not use ArcGIS Online reference data, nor does it require a feature class as input. It is a temporary overlay within the map view which does not require the ArcGIS Pro 3D Analyst extension – just an elevation surface.
- In a 2D map, go to the Map tab and select Add Data > Elevation Source to add your elevation surface.
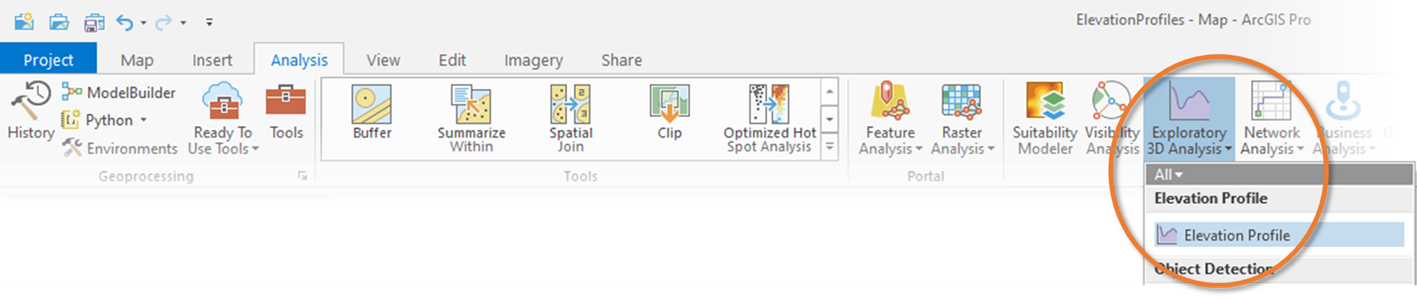
- Go to the Analysis tab and find the Workflows group, then select Exploratory 3D Analysis > Elevation Profile.
- Choose a creation method: Interactive Placement or From Layer (see below).
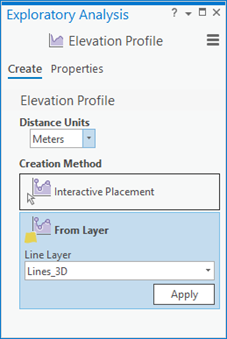
Interactive Placement allows you to draw a line (one click per vertex) where you want to generate a profile. You do not need to draw a vertex for every point on the graph – simply draw a straight line with two points, the resulting elevation profile will graph the line in detail.
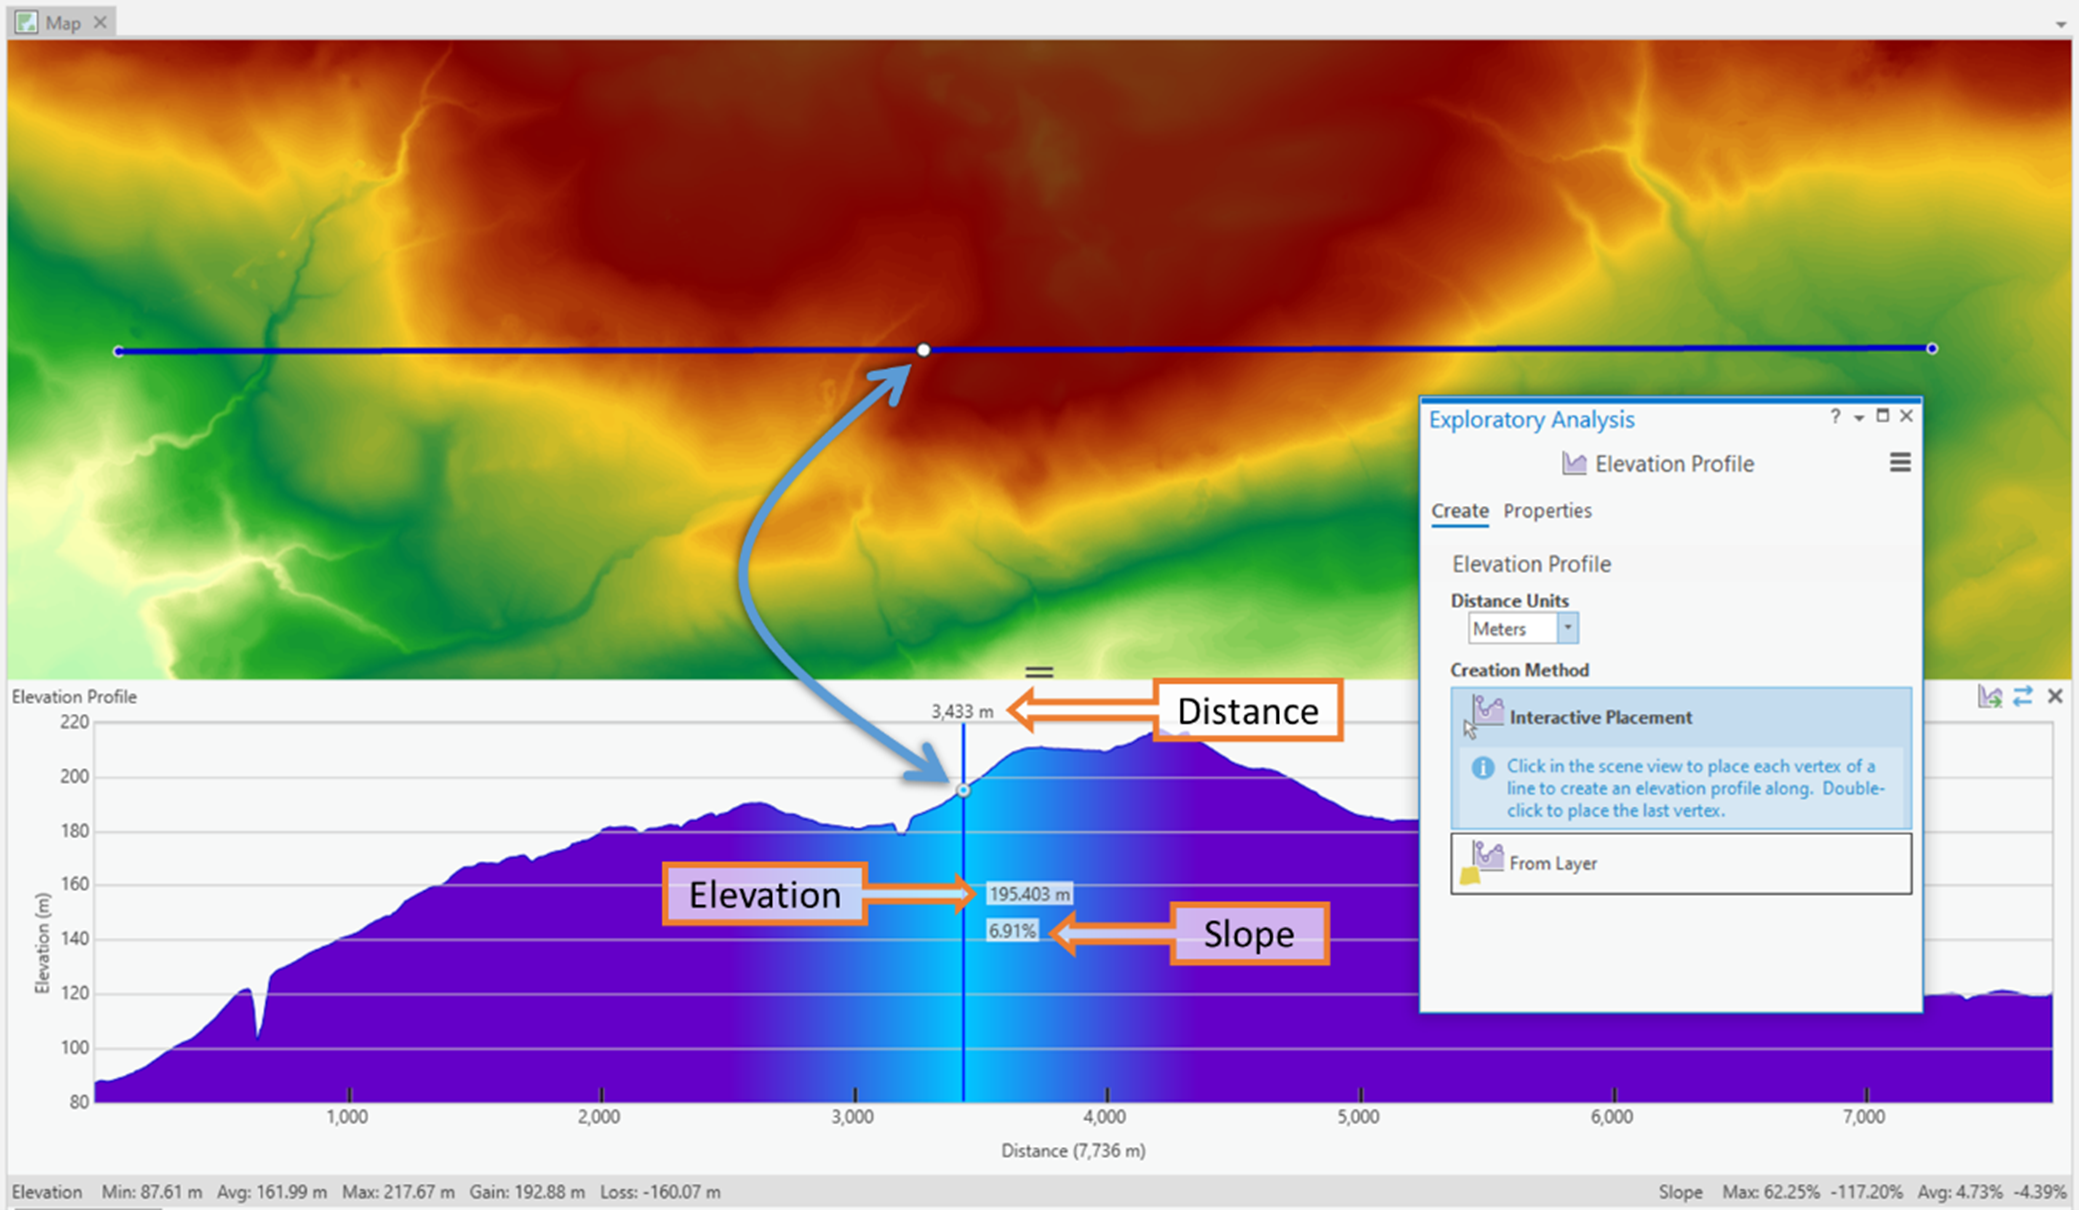
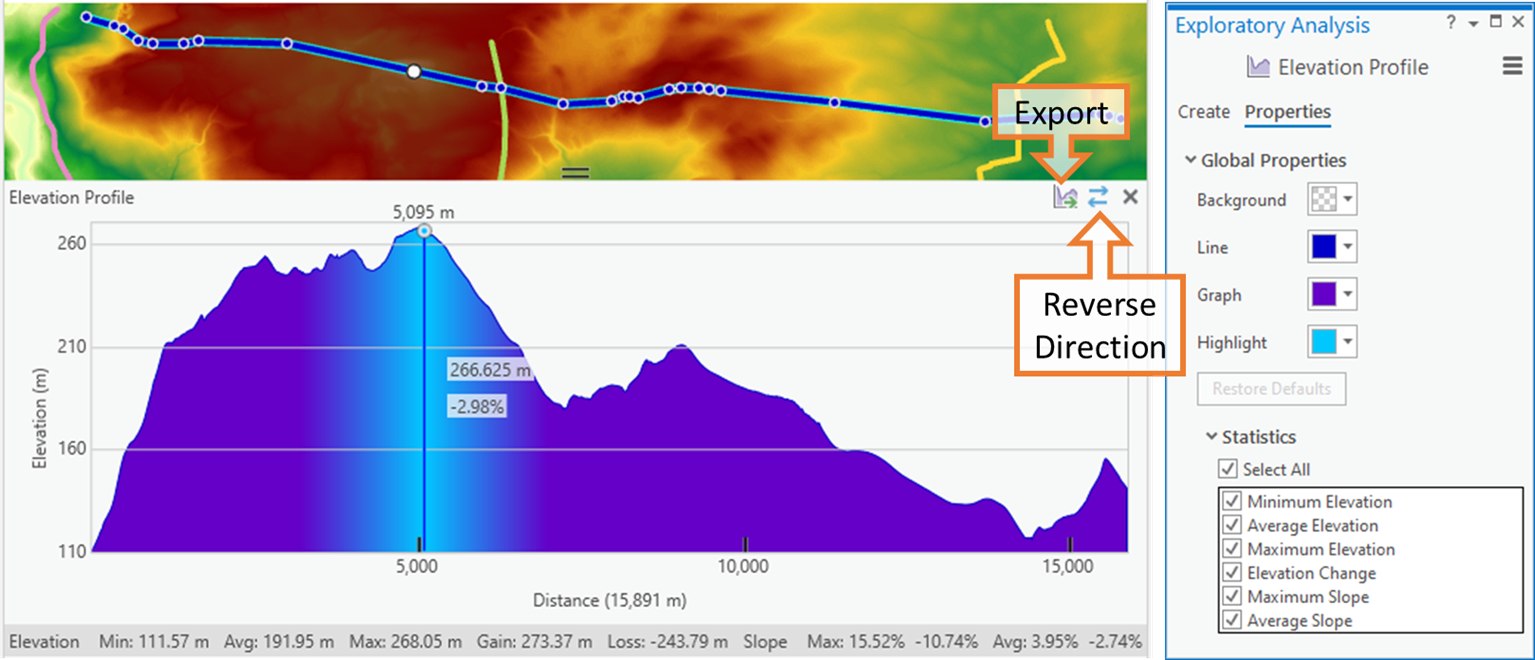
The white dot along the line in the map view follows your cursor along the graph so you can visually see where that point corresponds on the map. The graph overlay gives the elevation and slope at that distance along the line. You can use the Reverse Direction button to switch direction of the line.
Whilst you cannot add or remove vertices for the line you drew, you can move existing vertices to adjust the path of the line. Click and drag the vertex you want to move on the map and the graph will recalculate automatically.
The From Layer method allows you to select a line from an existing feature layer. This can be 2D or 3D – the map’s ground elevation surface is used to plot it, rather than the layer’s Z-values. The graph output itself is no different to the Interactive Placement method, but you can select a single existing line from a layer on the map. You can select multiple lines if they form a continuous path; you could, for example, select multiple segments from one pipeline. If those segments do not form a continuous path, however, the graphed portion will not include all of the selection.
Like Interactive Placement, the graph traces the elevation at a level of detail appropriate for the width of your map view window.
In the Elevation Profile itself, you can change distance units (these apply to both distance and elevation, rather than individually – use Profile Graph to control these individually). Colours for the background, map line, graph fill, and graph highlight can be customised. You can toggle on/off each item in the bottom row of elevation and slope statistics. The Export option creates an image of the entire profile window and is the only way to save your graph. For greater control over the output, including fonts, labelling or title, use the Profile Graph described in part one of this blog.
Here you can find a summary of the differences between Elevation Profiles and Profile Graphs.
Here you can find Part I – Creating Elevation Profiles in ArcGIS Pro
Posted by Alex Rexroad, GIS Consultant / Trainer


