Increase mapping productivity using Data Driven Pages
If you want to create a PDF map book or a map series covering a study area, you can do so with minimum fuss by using Data Driven Pages (DDP). The only thing you need to accomplish this is a polygon layer with a column which contains unique values.
The basic workflow
In this example, I am using UKCS Quadrants. The principle can be applied to regularly or irregularly shaped polygons. You can also use ArcToolbox to create your own grid. It can even be used for linear features (using the Strip Map tool in ArcToolbox).
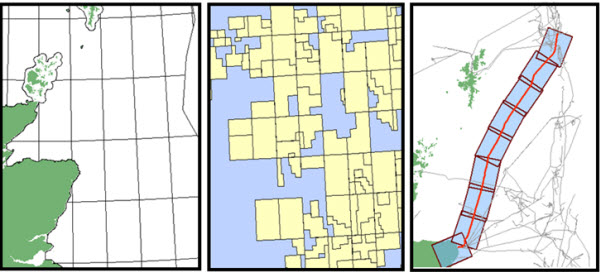
– Any polygon feature class with a unique value field can be used as a DDP index
1) Create a selection layer containing the features that you wish to use as your index layer. I have created one using UKCS Quads, which I shall use as the index layer for my map book
Note: You can do this without a selection layer if you want to map every index polygon.
2) Right click on the blank grey area of the toolbar in ArcMap and switch on the ‘Data Driven Pages’ toolbar.
3) Click on the left most icon to open the set-up window for DDP.
4) Check the ‘Enable Data Driven Pages’ checkbox.
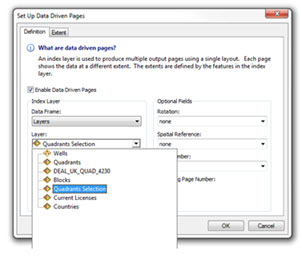
5) From the drop downs, pick the data frame, layer, name field and sort field you are using to for your DDP.
![]()
6) You will see more icons activate on the DDP toolbar. You will also see a number/name representing the first value in the DDP index, appear in in the centre (in this example it’s 12, which represents quadrant 12).
Note: While it would be nice to change the attribute to something more aesthetic, for example Quadrant 12 instead of just 12, it’s important to use a value for the quadrant that will be common across various datasets. The reason for this becomes apparent in the filtering section.
7) By clicking the arrows on the right and left of this index, you can page through your map extents.
Hiding features that aren’t in the current index area
DDP can also allow you to control which data is displayed on each map.
Note: For this to work, the layer must have an attribute field which contains the same value (including case and spaces, as ArcGIS is case/space sensitive) as the index attribute. In this example, the wells data layer needs to have an attribute field which is populated with the quadrant number for the quadrant in which the well sits – this field is named ‘QUAD’.
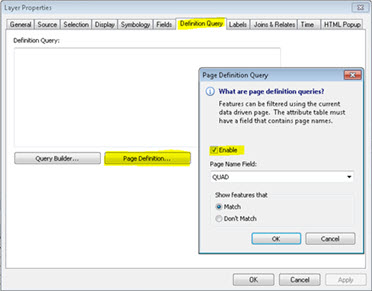
1) Open the layer properties for the layer (in this case the Wells layer) and click the Definition Query tab.
2) Click the Page Definition button
3) Check the ‘Enable’ checkbox to enable the page definition query functionality.
4) Select the field containing the index attribute (in this case the QUAD field) from the dropdown.
5) Select the ‘Match’ radio button. This means only those features within the current index area will display – ie, in this case, we’ll only see the wells that sit in the current quad.
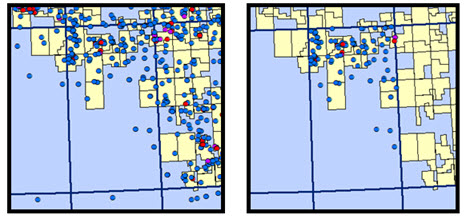
– Before and after applying a page definition to the wells.
Or, the other way around – hiding features in the current index area
In order to focus attention on the current index area, you can add semi-transparent masks covering the surrounding index areas.
1) Make a copy of the full index layer and move it to the top of the table of contents. This will be your mask layer.
2) Open the Layer Properties for the mask layer. On the Display tab set the fill colour for the mask layer to white and the transparency to 30%.
3) Repeat the steps described in the previous section for setting a definition query using the mask layer but select the ‘Don’t Match’ radio button in the final step. This will mean that only features that are not within the current index area will be displayed – ie, in this case, the quadrant polygon covering the current index area will not be displayed, highlighting it.
Creating an index map
In order to let the map user quickly work out where the current map sheet is located, you can add an index (or overview) map, as shown below.
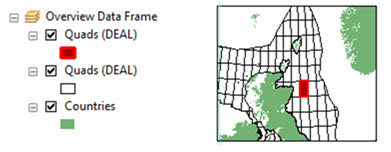
To do this:
1) Create a new data frame (Insert Menu / Data Frame). This will host the overview map, which lets the map user see where the quadrant is located.
2) Add some context layers – in this case, I’ve added two copies of the index layer (Quads) and a countries layer to give geographical context.
3) Set a page definition query on the uppermost, red, Quads layer so that it only displays the current index area (using the method described above).
4) In layout view, place the data frame in an appropriate position in your map layout.
Adding dynamic text
1) Switch over to layout view and create a layout for your map. If you look on the right side of the DDP toolbar, you will see a button called Page Text. This allows you to add dynamic text. I’ve simply added a bit of dynamic text to the map title properties, so that it will reflect the quadrant currently displayed by DDP.

2) If you have some stats in the index layer, say the number of completed wells in the quad, you could also bring this in dynamically. More information on dynamic attribute text can be found on Esri’s Knowledge Base.
It’s the final countdown layout
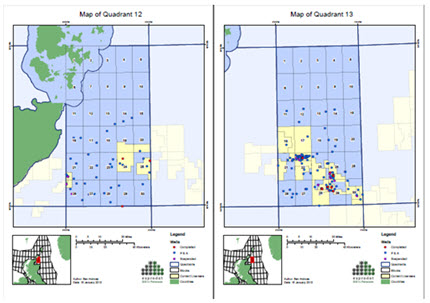
An example map made with my final layout looks like this:
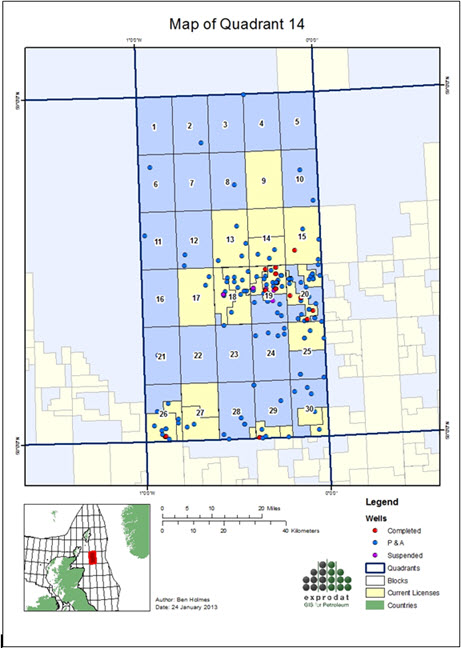
I have also added the blocks to the main map, using a Match page definition, and labelled them with the block numbers.
Printing or exporting the map book
1) To get your maps out or ArcGIS, you can simply print them or export them to PDF.
2) The print dialog has a Data Driven Pages section that allows you to choose which pages to print, if you don’t want to print all of them.
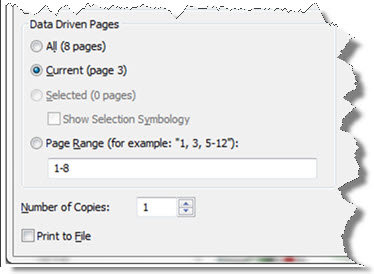
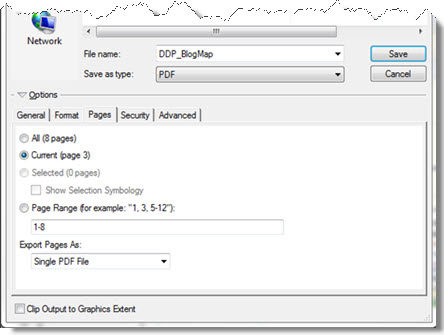
3) The PDF export options also contain controls which allow you to exported selected pages, as well as allowing you to export your selection to a single PDF or to multiple PDFs:
Summary
Data Driven Pages provides the ability to quickly create a high-quality map book or map series in a repeatable fashion, greatly reducing the amount of time required to create such products, compared to conventional cartographic processing.
Through the use of the arcpy.mapping module, it is possible to extend data driven pages much further. This can be simply adding a cover page or other non-map PDF pages to your map book. With a little more python knowledge you can add in pseudo-dynamic tables to your layouts, as shown in this sample from the Esri Geoprocessing Model and Script Tool Gallery.
Posted by Ben Holmes, GIS Consultant, Exprodat.


