The GeoEvent Processor is an extension for ArcGIS for Server version 10.2 that processes real-time data – for instance, vessel or vehicle position information. In addition to allowing the display of real-time data in, um, real-time, the GeoEvent Processor provides GeoFence and other functionality that enables alerts to be automatically generated – for instance, you might want to know when a vessel or vehicle entered or exited a specific area, or when it went it ‘off-route’ – these alerts can be published in a number of ways, including by text and instant message.
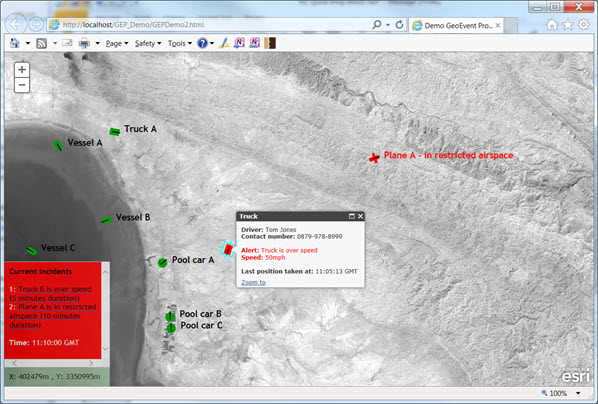
The screengrab below shows a simple example for monitoring the location of vehicles in a study area. Having the location feeds from the different vehicles is essential, and there are a variety of means to generate and receive these, from radio beacons to mobile phones. The technology that you can employ will vary with your budget and where you are in the world – we’ll look to cover these in a future blog.
Landsat 8 Imagery from USGS.
Getting to grips with it
So, you’ve installed the GeoEvent Processor and you’re eager to experiment with it. There are some sample files that you can use with the GeoEvent Simulator, but they don’t cover your area or represent the sort of data that you’re anticipating receiving (or you need something to convince your managers to invest in tracking technology!). What to do? Well, you could embark, as I did, on a voyage through a set of functionality that I’d previously heard of but never used – linear referencing.
For my purposes, I wanted to generate a simulated GPS feed that represented a vehicle travelling along a road, at variable speed, with pause points – something that would look vaguely convincing when used as a feed for the GeoEvent Processor. So, first up, I digitised my road, using a satellite image for a randomly selected area as a guide. I then created a point feature class and added points along the road, at which various events would happen – the vehicle speeding up from 30mph to 50mph, the vehicle stopping for 5 minutes, that sort of thing. I then faced the problem of how to interpolate the positions between my points, so that a convincing set of GPS points would be generated. It was at this point that I started looking at linear referencing.
Linear referencing, put simply, uses distance along a line to describe the location of features or events. Using the geometry of the line, the exact coordinates of the features can be extracted. As I ‘knew’ where my events happened, I could extract the distance along the route at which they occurred and then use that information to interpolate the intervening sample locations. All I needed to do was to use the appropriate ArcToolbox functions and then write some Python…
Converting lines to routes
Using the Create Routes tool in ArcToolbox, I created a route from my digitized road. An interesting point to note is that the direction of the route generated may not be the same as the direction of the road that you digitized – there is a control in the Tool that allows you to define which corner of the bounding box to use as the ‘origin’ location – you need to ensure that this is set to the corner closest to the start of your route.
Converting events to referenced points
Armed with my new route, I then used the Locate Features Along Routes tool to generate an Event Table, shown below, containing the measure locations for my events along the route – the tool added the RID (Route ID) and MEAS (MEASure) fields to the input table.
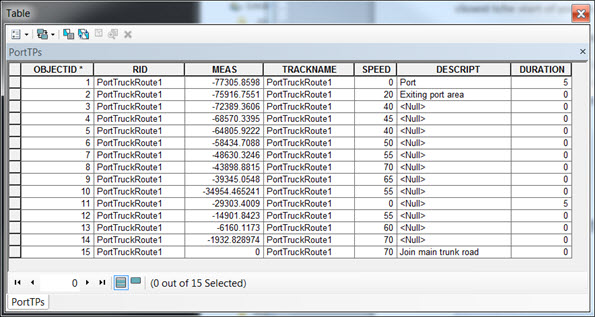
Note that my measure values increase from a negative value towards zero as I failed to pick the correct bounding box corner when generating the route. I worked around this by simply multiplying the measures by -1 to get the route to go ‘in the right direction’.
Python
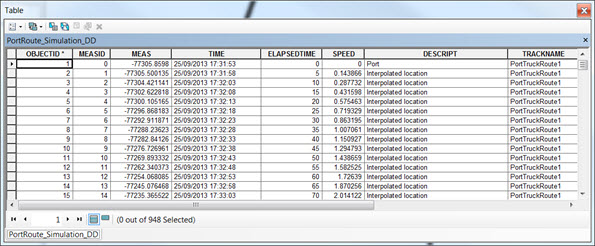
Having generated the table shown above, I was able to generate the interpolated points between my events using Python. My script looped through the events, calculating the time at which each would occur, and generated points to fill in the gaps, at specified time interval (5 seconds in this example). The new table contained measure distances for each interpolated location, as well as a time, an elapsed time and a speed (the speed is given in metres per second, as I’ve not gotten around to adding a scaling factor back in).
Converting events to point locations
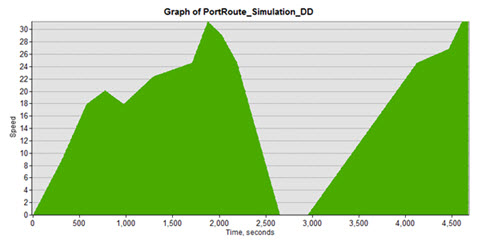
Having generated my interpolated locations, I added this table back to ArcMap and then used the Graph function to confirm that the way in which the speed of the vehicle changed was reasonable (perhaps not entirely realistic – the accelerations and decelerations are linear, but it’s good enough):
Using the Make Route Event Layer tool I converted the values in my table to points on a map. I then added the XY coordinates to the points feature class that I created from the Event Layer. I now had all the data I needed for my simulated GPS feed.
Using the GeoEvent Simulator to feed the GeoEvent Processor
Next, I saved the attribute data out as a CSV file. I then loaded this file into Excel to add a SHAPE field into which I concatenated the XY coordinates – this step is necessary as otherwise, in my experience, the GeoEvent Processor doesn’t correctly generate the point location.
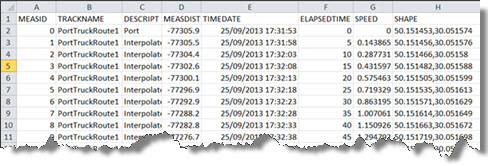
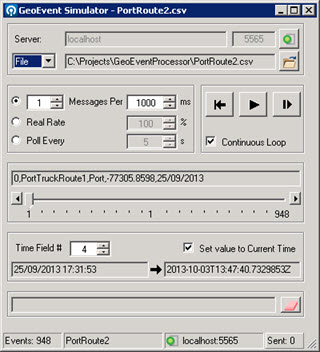
Having done that, my CSV file was ready for use in the GeoEvent Simulator, which comes with the GeoEvent Processor:
The final result
I created an input, a service and an output in the GeoEvent Processor, then pressed play on the GeoEvent Simulator and watched as my simulated points streamed through into my output Feature Service. A quick bit of coding using the JavaScript API then allowed me to visualise the points as they came in, in ‘real time’.
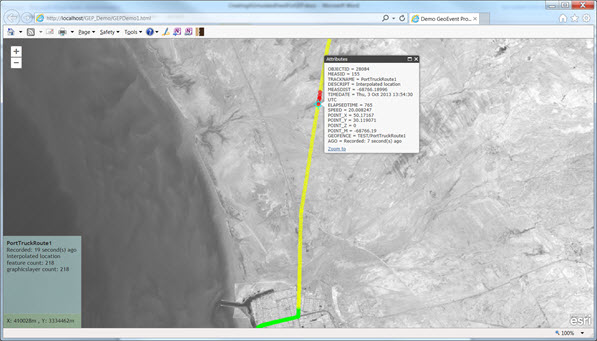
Landsat 8 Imagery from USGS.
Having generated a feed, it was then time to look at GeoFences, but a discussion of that will have to wait for another blog.
Posted by Ross Smail, Research & Development Manager, Exprodat.


