Mapping gas hydrate occurrence in permafrost regions using a play fairway mapping approach.
I have recently become very much interested in the subject of gas hydrates and have started, in my spare time, to do some research on this really interesting subject. I am by no means a gas hydrates scientist, but being a geologist working with GIS in the petroleum GIS sector, the subject falls within my sphere of interest.
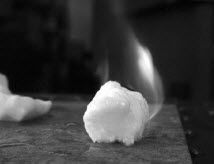
Figure 1 – Gas Hydate (Masutani and Tang, University of Hawaii, Natural Energy Institute. Copyright ©2003).
For those of you who are not familiar with the subject, gas hydrates are ice-like crystalline solids composed of water and gas in which water molecules trap gas molecules in a cage-like structure (Figure 1). This structure can be formed when the right combination of high pressure and low temperature is reached.
Gas hydrates are known to occur fundamentally in two specific environments on Earth:
- in seabed sediments of deep water sections of most continental margins.
- in inland regions covered in permafrost.
Occurrence of gas hydrates in nature was inferred nearly 40 years ago, although only relatively recently has this interested the scientific community. This is because the amount of gas trapped within the crystalline solids is potentially huge, so the resource may be economically exploited.
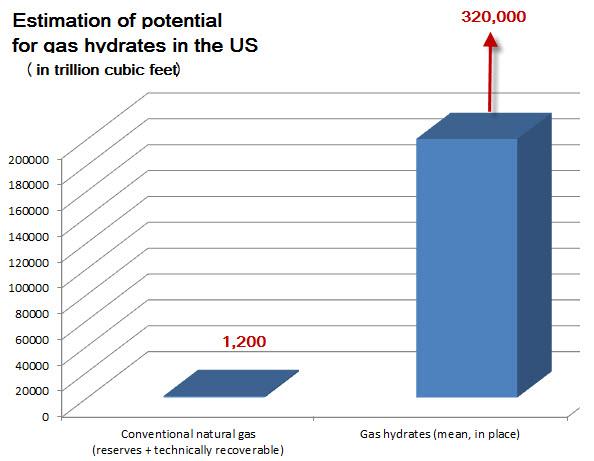
Figure 2 – US potential for gas hydrates compared to conventional gas sources (after USGS).
In a recent study the United States Geologic Survey (USGS) estimated that the amount of gas which could be provided by this unconventional source may be more than 250 times the amount of technically recoverable and proved gas reserves in the US (Figure 2).
The great interest which gas hydrates have generated is also due to the potential effect that the release of the trapped gas into the atmosphere could have, for instance due to the melt of permafrost caused by climate change. The potential link between the release of gas from hydrates within the sea bottom sediments and geohazards such as submarine landslides is also being investigated by research and industry organisations around the world.
I thought that it would be interesting to carry out some analysis to help both the search for new gas reserves and the research concerning geohazards and climate change issues. So, I’d like to share an example where I’m using GIS to determine the probability of the occurrence of gas hydrates by applying the concepts of play fairway mapping. As in any conventional play, my workflow starts with the identification of the elements which are relevant in determining the presence of oil or gas.
The study area and the play inputs are discussed below.
Gas hydrates in permafrost regions
As in my other blogs I’ve been constrained by what GIS data is available in the public domain. As you can expect there is not really much out there, especially for the continental margin areas.
However, there is data available for the Qinghai-Tibet plateau in the People’s Republic of China (Figure 3). With a mean altitude over 4000 m asl and permafrost coverage of about 52% of its total area (approximately 140×104 Sqkm), the plateau appears to have potential for the occurrence of gas hydrates.
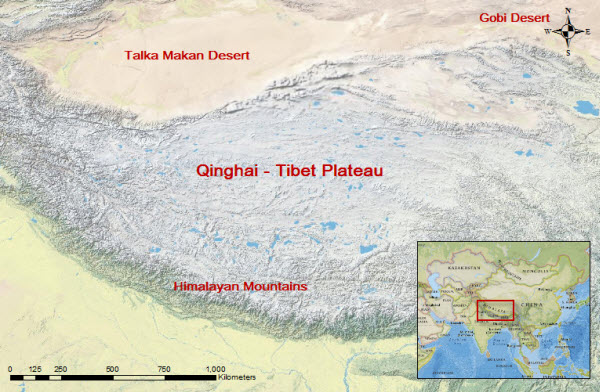
Figure 3 – Location of the Qinghai-Tibet Plateau.
Researches have demonstrated that hydrates can occur within the bedrock of environments such as the Qinghai-Tibet Plateau when a sufficient thickness of the permafrost is in place. For hydrates to be stable both temperature and pressure conditions within the sediments underneath the permafrost have to fall within a range called the ‘stability zone’. The stability zone is influenced by the composition of the gas hydrates (pure methane or a combination of gases), the salinity of the pore fluids within the bedrock and the annual ground mean temperature.
The graph in Figure 4 shows the stability zone for two different compositions of the gas hydrates. In this graph pressure has been converted to depth both for the permafrost as well as for the underlying sediments, assuming zero fluid salinity. Geothermal gradients for permafrost and sediments have been estimated based on borehole measurements in areas adjacent to the plateau.
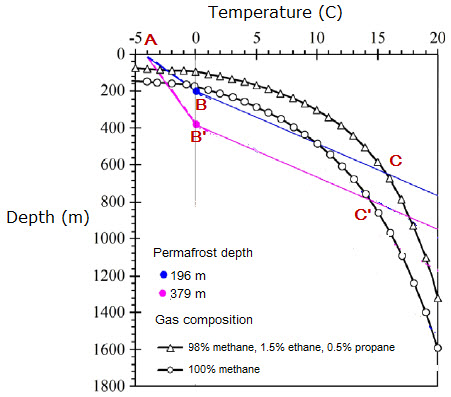
Figure 4 – Stability Zone for Gas Hydrates (after Qingbai)
From this graph it is easy to determine which of the conditions needed for gas hydrates to form in this environment are stable over time.
For the 98% methane/1.5% ethane/0.5% propane molecule and a permafrost gradient of 1.1 °C/100m, these can be summarised as:
- Minimum thickness of permafrost in place: 133 m (point B)
- Annual mean ground temperature: lower than -1.5°C.
These elements, along with the presence of hydrocarbon source rocks to ensure that natural gases are generated in the first place have been used as input to my analysis.
Gas hydrates potential occurrence analysis
The play elements which I’m going to use as input to the play chance mapping exercise are as indicated below:
1) Presence of source rocks beneath the permafrost: the Qiangtang Basin in the central area of the plateau (Figure 5A) shows a wide distribution of thick Mesozoic sediments that have a high concentration of organic matter. This bedrock has a high potential for hydrocarbons in general, including the generation of gas hydrates.
In this analysis I did not consider secondary pathways migration, therefore I’m assuming that accumulations of gas hydrates would coincide spatially with the distribution of the source rocks.
2) Annual mean ground temperature below -1.5°C (Figure 5B).
3) Presence of permafrost coverage (Figure 5C), with a minimum thickness of 133 m (Figure 5D).
The four conditions above need to coexist spatially in order to generate the potential for the accumulation of the gas hydrate type considered here.
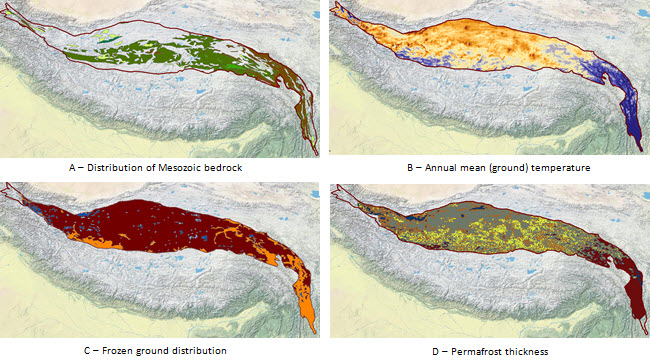
Figure 5 – Play Elements in the Qiangtan Basin
Using a common risk segment/play chance mapping approach to the above play elements allows the layer stack to be re-classified to probability and the overall chance of gas hydrates being generated and accumulating within the Mesozoic bedrock of the Qinghai Basin to be calculated.
To do this I used Exploration Analyst to create probability layers from input datasets and combine them together to obtain an overall probability for gas hydrates occurrence. The components indicated in Figure 5 have been combined in order to calculate probability of occurrence expressed as a 0 (will not occur) to 1 (will occur) scale range. The probability values indicated in Table 1 have been used.
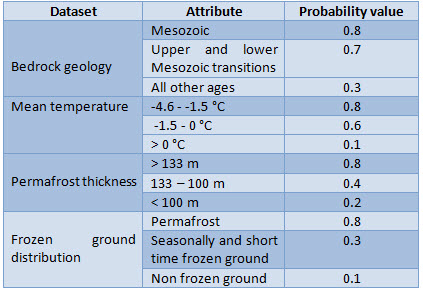
Table 1 – Probabilities Used in Analysis
Ranking parameters were chosen to take into account the relative confidence level (for instance assuming that air temperatures correspond to ground temperature) and relative quality of the datasets I used. I used the Product method to derive the overall chance of occurrence.
Results and discussion
Results of my analysis are shown in Figure 6, which shows areas within the Qiangtan Basin with a medium to high probability of occurrence (medium and dark brown colours).
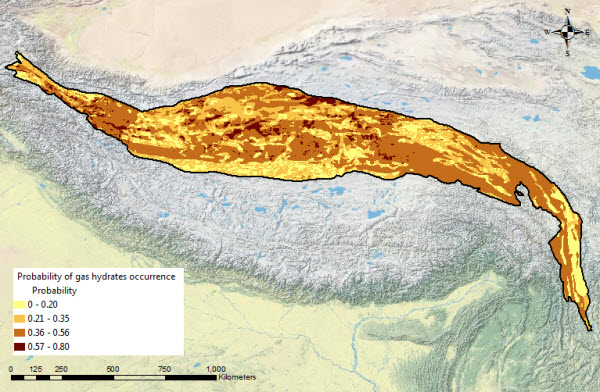
Figure 6 – Gas Hydrates Chance of Ocurrence
These areas are located primarily in the eastern and western section of the basin and show good spatial continuity. The central region shows a more patchy pattern, where areas with lower probability alternate with areas with higher probability of occurrence.
Of course a more in-depth study would ideally see a sensitivity analysis carried out on the weighting factors along with the gathering of detail datasets specifically for the basin area. However, I think this exercise has shown the flexibility of the ranking approach used by Exploration Analyst, where concepts used in a typical play mapping workflow can be extended to mapping occurrences of unconventional resources such as gas hydrates.
Posted by Paola Peroni, Senior GIS Consultant, Exprodat.
References
1. United States Geological Survey (USGS), 2008, Assessment of Gas Hydrate Resources on the North Slope, Alaska
2. UNEP/GRID-Arendal, 2012, Global Outlook on Methane Gas Hydrates.
3. S.J. Day and M. Maslin, 2010, Gas hydrates: a hazard for the twenty-first century?. Philosophical Transaction of the Royal Society.
4. Duo-Fu, Mao-Chun, Bin, 2005, Formation condition and distribution prediction of gas hydrate in Qinghai-Tibet Plateau permafrost. Chinese Journal of Geophysics, Vol. 48, No. 1, pp 179-187.
5. Qingbai, Guanli, Peng, 2010. Assessing the permafrost temperature and thickness conditions favourable for the occurrence of gas hydrate in the Qinghai-Tibet Plateau. Energy Convention and Management Journal.
6. Cheng, Wu, 2007, Responses of permafrost to climate change and their environmental significance, Qinghai-Tibet Plateau. Journal of Geophysical Research, Vol. 112, F02S03.
Data
Here’s a description of the GIS data I used and related sources:
1. Data about geology and basins of the Asia-Pacific region was downloaded from the USGS website.
2. Glaciology and geocryology datasets (permafrost distribution, thickness) were provided by the WDC for Glaciology and Geocryology at Lanzhou.
3. WorldClim 2.5-arc minute world temperature map. Note that temperature values in this dataset have been assumed to be representative of ground temperature rather than air temperature.
4. Base map was taken from Esri’s ArcGIS online.


