As governments around the world look to accelerate their energy transition efforts with increasing investment in offshore wind (such as the recently announced schemes in the UK and the US) it is more important than ever that the tens of thousands of megawatts of electricity required to power the homes and cars of the future are generated in the most cost-effective and efficient way possible. Key to this efficiency/cost equation is the location of the wind farm (“macro-siting”) and the precise layout of the turbines and cables within the wind farm (“micro-siting”).
Introduction
There are three primary micro-siting considerations when designing the optimum layout for an offshore wind farm: sea-bed environment, wind characteristics and electrical cable layout. In traditional offshore wind farm development planning these factors are often considered in isolation, but research has shown that wind farm development costs, maintenance costs and operational performance can be significantly optimized through integrated planning.
The ArcGIS technology stack, and specifically ArcGIS Pro, is uniquely positioned to meet this challenge, with its combined capabilities of spatial analysis, 3D visualisation/analysis and network analysis. There are, of course, existing specialist tools and software applications that address the key micro-siting technical design challenges, but few (if any) consider the factors in an integrated fashion. In addition, running the analysis in the ArcGIS Pro environment provides significant data integration benefits, enabling visualisation and analysis of the wide range of related data and information that a wind farm planner might be interested in – such as bathymetry, topography, geology, shallow marine site surveys, seismic data, utility networks, wind data, line of sight analysis, market data and so on.
In the sections below we present a toolkit developed using the ArcGIS Pro SDK that provides offshore wind farm planners solutions to these key micro-siting challenges, by rapidly creating turbine layouts and assessing their suitability in terms of wind power generation and cable array efficiency, all within the powerful ArcGIS Pro application.
Key workflows
The toolkit we developed performs the following key workflows – all seen as essential to planning the optimum offshore wind farm turbine layout:
- Optimising the placement of wind turbines around unsuitable locations (“constraints”).
- Modelling how wake interference impacts power output for turbine patterns given different wind speed and direction.
- Calculating the shortest cable network array to connect the turbine locations to the wind farm substation.
Example project – Rampion
In this blog, we use the Rampion wind farm to demonstrate our toolkit results and provide a comparison with a previously designed, real world, wind farm. It’s important to note that we are not suggesting here that Rampion’s design and development (approved by the UK Government in 2014) is flawed in any way – clearly, having delivered the wind farm via rigorous design and planning processes, the designers and the operator of Rampion have had far greater visibility and knowledge of the myriad factors influencing the micro-siting than we have had during our modelling. However, the comparisons are useful in terms of assessing the results of the toolkit.
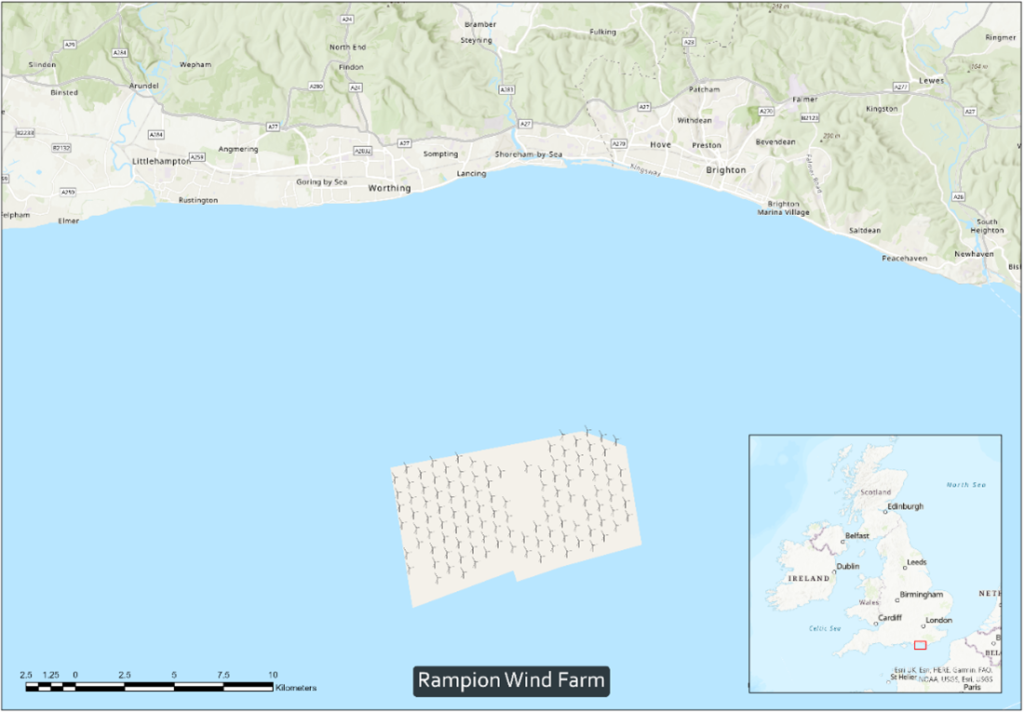
Rampion is a U.K. development operated by E.ON and located between 13 and 20 km from the Sussex coast, comprising 116 individual 3.45 MW turbines covering an area of c. 72 square kilometres (see Figure 1). Note the irregular shape of the wind turbine pattern outline and the internal “holes” where turbines could not be placed – presumably all due to sub-optimal local factors such as seabed conditions.
Placing turbines around constraints
The toolkit we developed allows you to optimise the placement of wind turbines within a given area (e.g. a wind farm outline). Supported turbine pattern geometry types include cubic, orthogonal and hexagonal. An azimuth is specified to control the dominant orientation of the pattern in order to optimise turbine exposure to the prevailing wind direction. Additional options enable alternate turbine rows to be offset by 50% of the spacing distance, and for rows of turbines to be placed at oblique angles.
If turbines already exist in the study area, or the location of some turbines have been pre-determined, these can be specified as ‘fixed locations’ around which the other turbines can be fitted.
Turbine placement can be further restricted through the use of a “constraints model”, which identifies areas where turbines cannot be placed (e.g. to avoid obstacles such as existing infrastructure, cables, RADAR pathways, wrecks and shipping lanes). A tolerance value can be specified which defines a maximum distance that any turbine can be moved from its optimal position in order to avoid a constraint.
The user defines the number of iterations the tool should run, with each iteration generating a pattern whose initial anchor point is different from each other iteration. The results, including a turbine count for each iteration, are added as layer to the map so they can be compared.
The tools can be used to maximise the number of turbines that can be placed within the wind farm area in order to maximise possible power generation, as well as find the most efficient layout for a pre-defined number (e.g. a maximum number of turbines already decided by planning authorities).
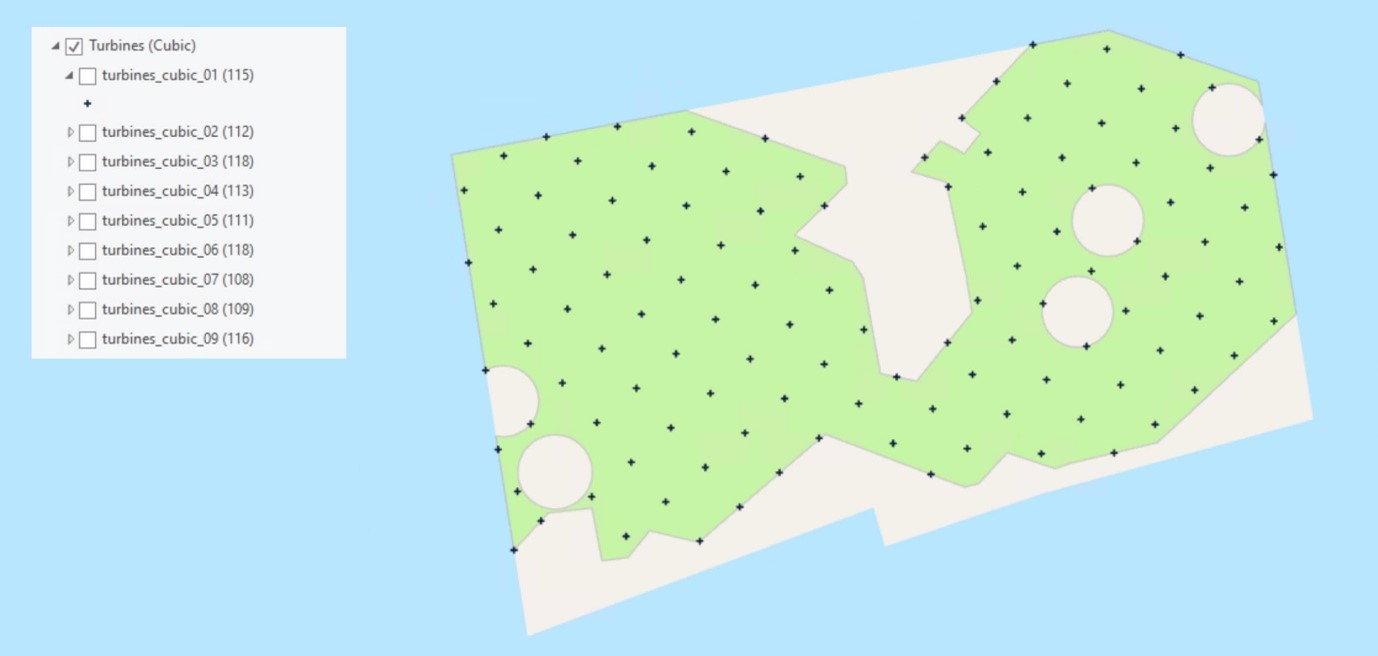
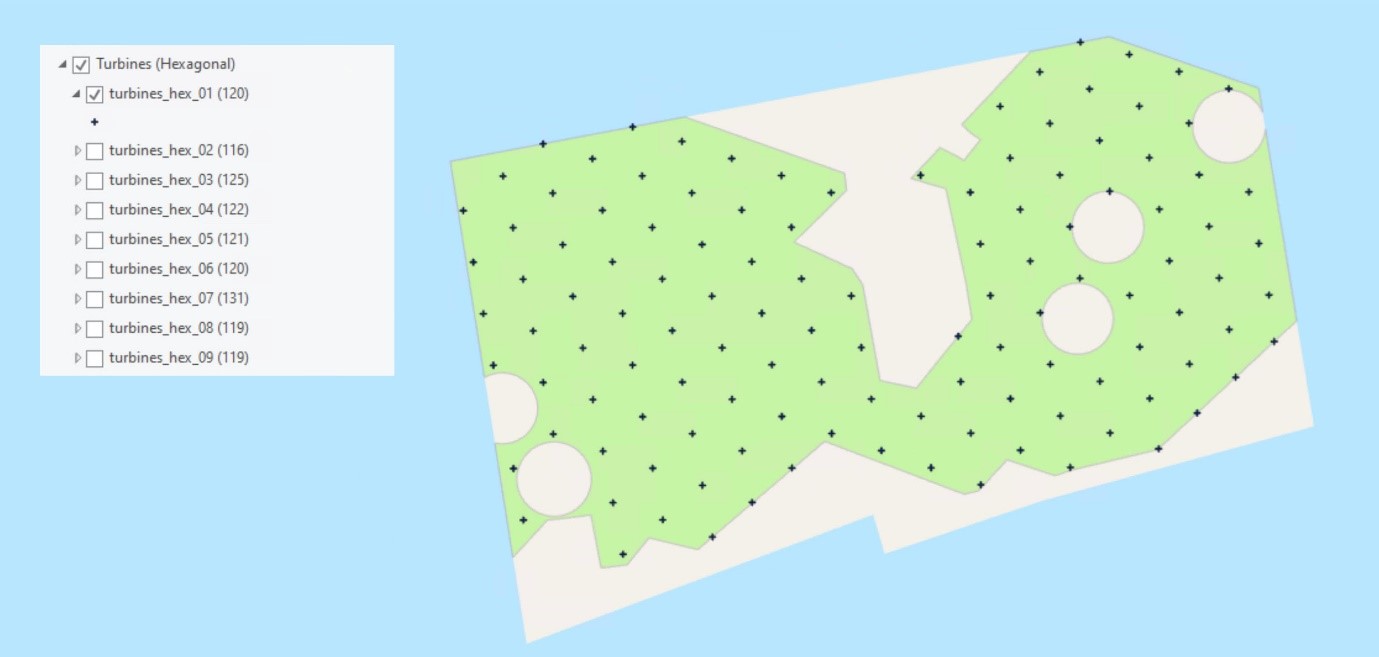
The example outputs below illustrate turbine layout iterations for different layout types (cubic, orthogonal and hexagonal) based on the same prevailing wind direction and an estimate of the same seabed constraints – note how the tool produces a wide range in the total turbines that can be fitted into the wind farm area, from 108 to 131.
These results (up to 131) compare favourably with the actual number of Rampion wind turbines (116) showing that it would have been possible to place a significantly greater number of wind turbines in the development using the same constraints model, and so potentially generate additional power – assuming increasing the number of turbines would have been allowed by the planning authorities, which isn’t always the case.
Creating wake models to analyse power output
The wake of disturbed air produced by each turbine in a wind farm significantly decreases the wind speed immediately downwind of the turbine – this in turn significantly decreases the power generated by such a downwind turbine. Where downwind turbines fall within the catchment of multiple wakes this decreasing windspeed effect compounds wake losses across the entire development, leading to significantly reduced wind speeds and power output in all downwind zones.
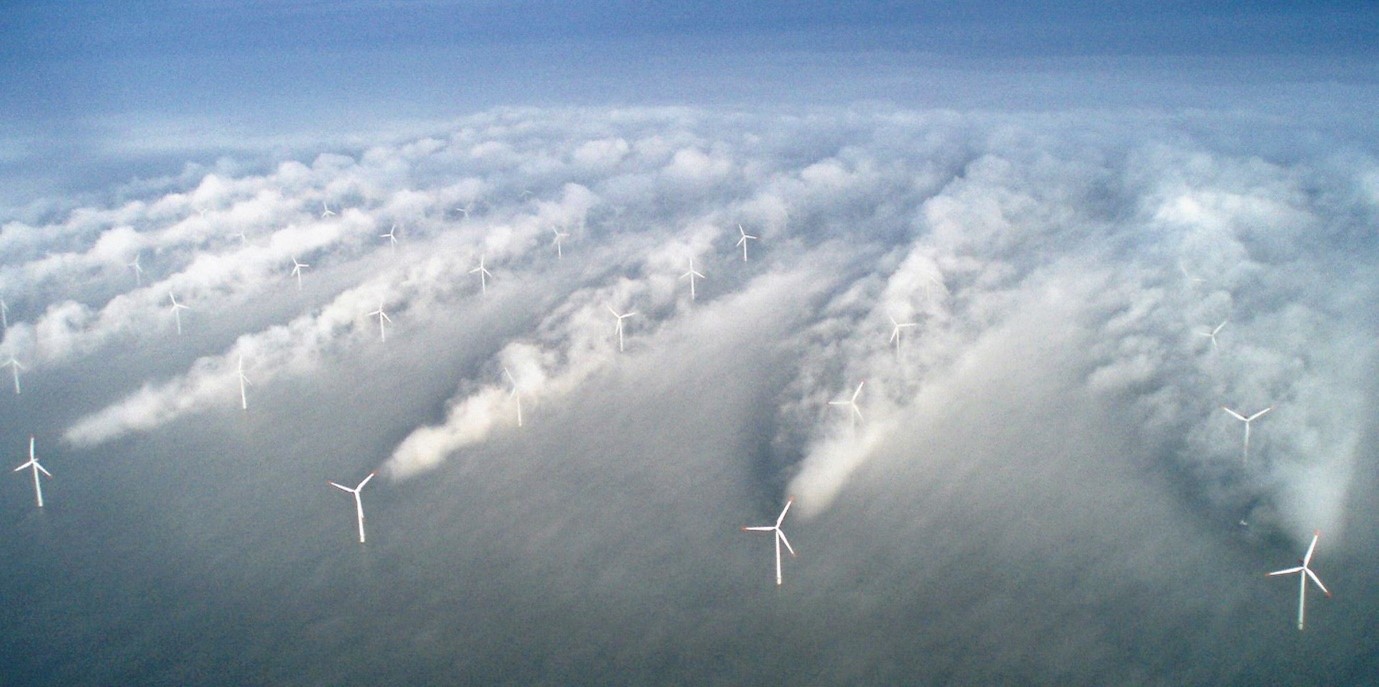
Figure 5 – A light fog reveals the wake effect behind turbines at Vattenfall’s Horns Rev wind farm off Denmark (photo: Vattenfall).
The ArcGIS Pro toolkit models the wakes for any input turbine pattern and generates layers representing wakes and wind speeds at regular intervals on the downwind side of each wind turbine. The algorithm uses the simple industry-standard Jensen method for generating wakes, based on parameters provided by the user including wind speed and direction, turbine radius and height, entrainment constant and thrust coefficient. Wind power is calculated and reported for each turbine based on the wake models generated.
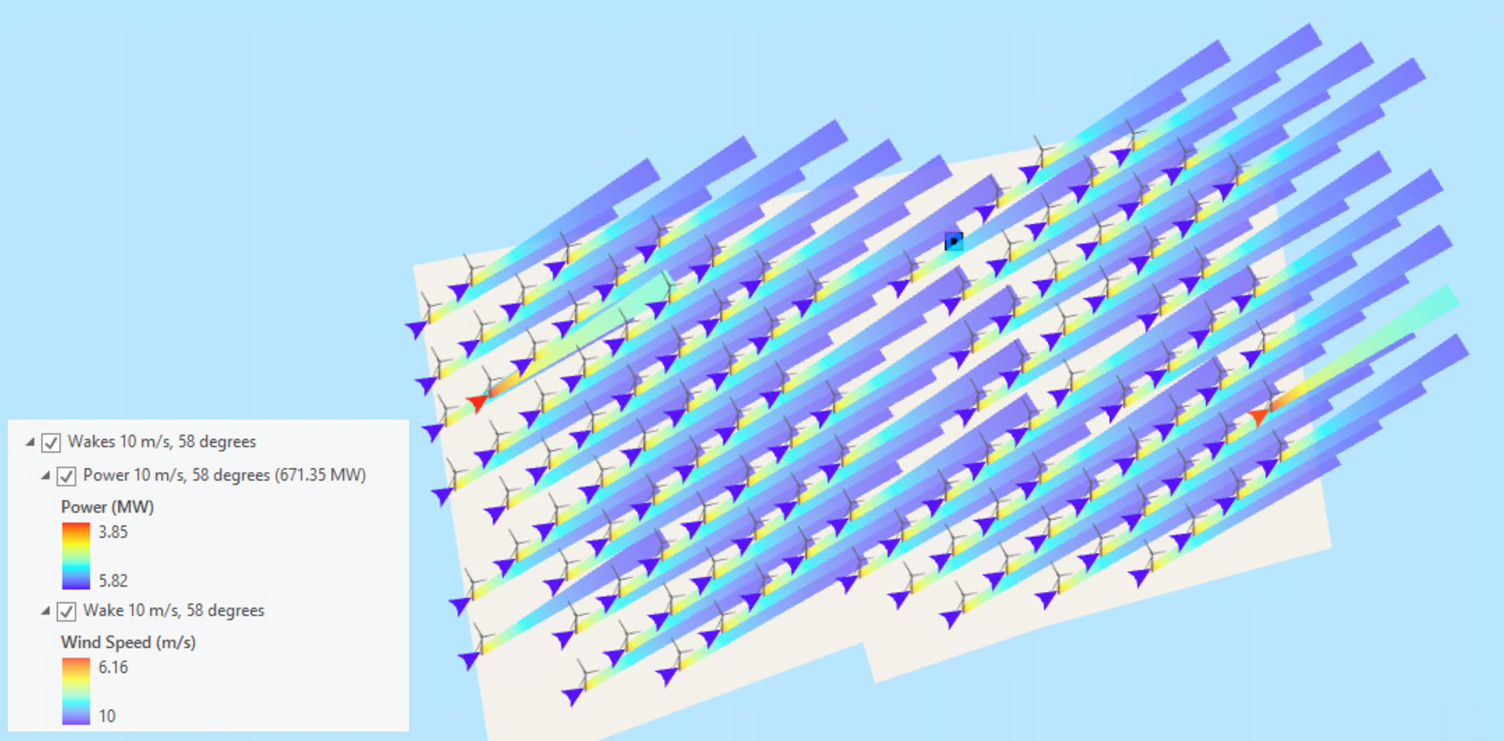
The toolkit outputs a polygon layer formed of multiple segments, each with an attribute representing wind speed at that location in the downwind side of the turbine. Together the segments form a cone shape continuing in the downwind direction from the turbine until the windspeed has recovered to close to the initial windspeed. Where a turbine falls inside one of the wake segments, the initial windspeed used to generate that turbine’s wake model is taken from the wake model in which it falls. This means the cumulative effect of wind speed decreasing in the downwind direction within a wind farm is captured in the modelling and visible as red segments in the output wake model layers (see Figure 6).
In addition to the wake model layer, a point layer is generated representing available wind power at each turbine location based on wind speed and the other parameters provided by the user including air density. The power for each turbine is represented by an arrow representing wind direction and rendered with a graduated colour representing the calculated power. Again, the influence of turbine wakes is clear to see as wind speed and therefore available wind power decreases due to wake effect in the downwind side of a development (see Figure 7).
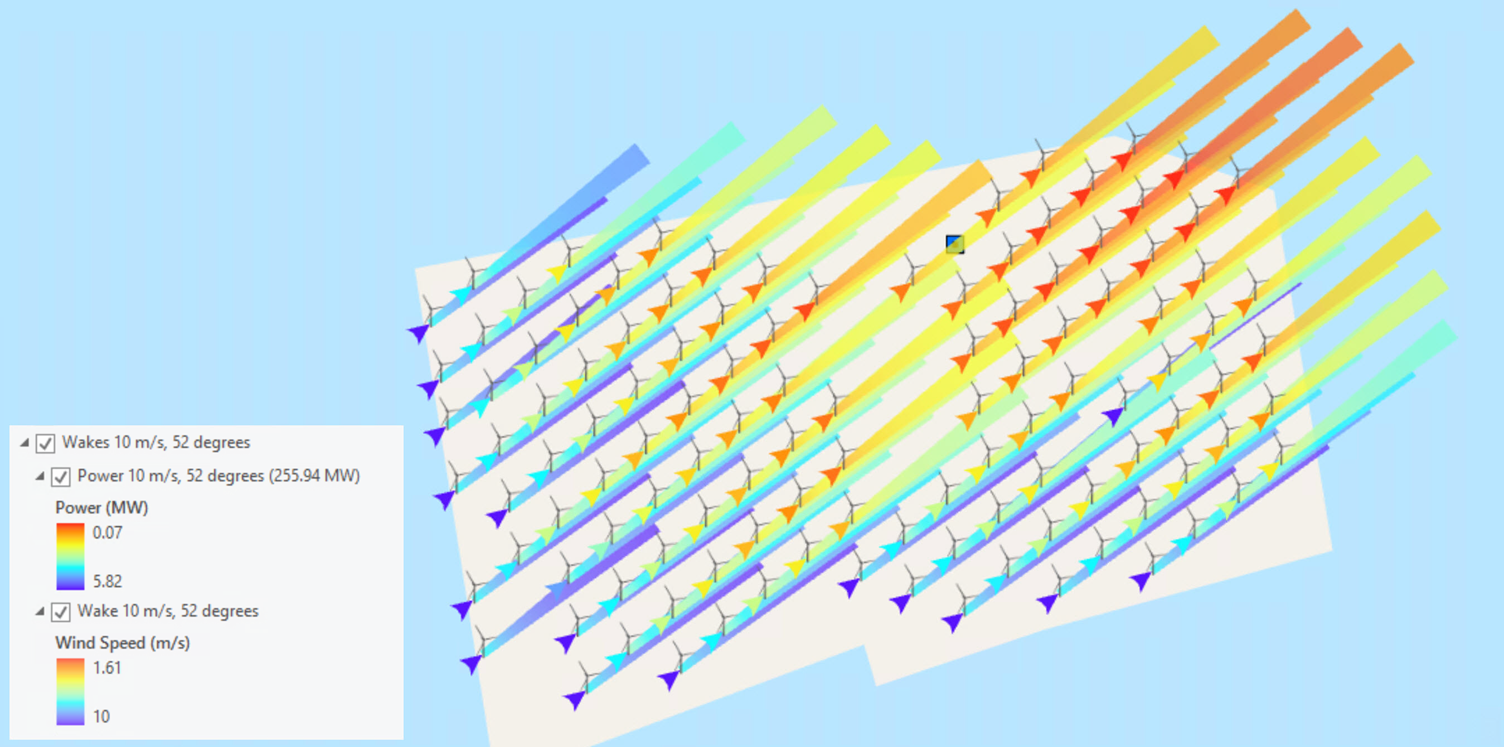
Figure 7 – Wake Model and Power Output at 52 degrees wind direction.
Subtle changes in wind direction can have a significant effect on wind speed in the downwind direction, as demonstrated in the examples of the Rampion windfarm shown above. With a wind speed of 10 meters per second (m/s) and a wind direction of 58 degrees, downwind turbines experience minimal wake interference, with the minimum wind speed across the entire development dropping from 10 m/s to 6.16 m/s (see Figure 6), but only at 2 turbine locations.
However, a wind direction of 52 degrees means more turbines ‘line-up’ in the wind direction, leading to a significant drop in wind speed due to wake interference at the downwind turbines, with the minimum wind speed across the entire development dropping from 10 m/s to just 1.61 m/s, and at multiple locations. This in turn leads to a reduction in total available wind power to 256 MW – compared to 671 MW at the 58 degrees wind orientation this is a significant amount of potential power generation lost (see Figure 7).
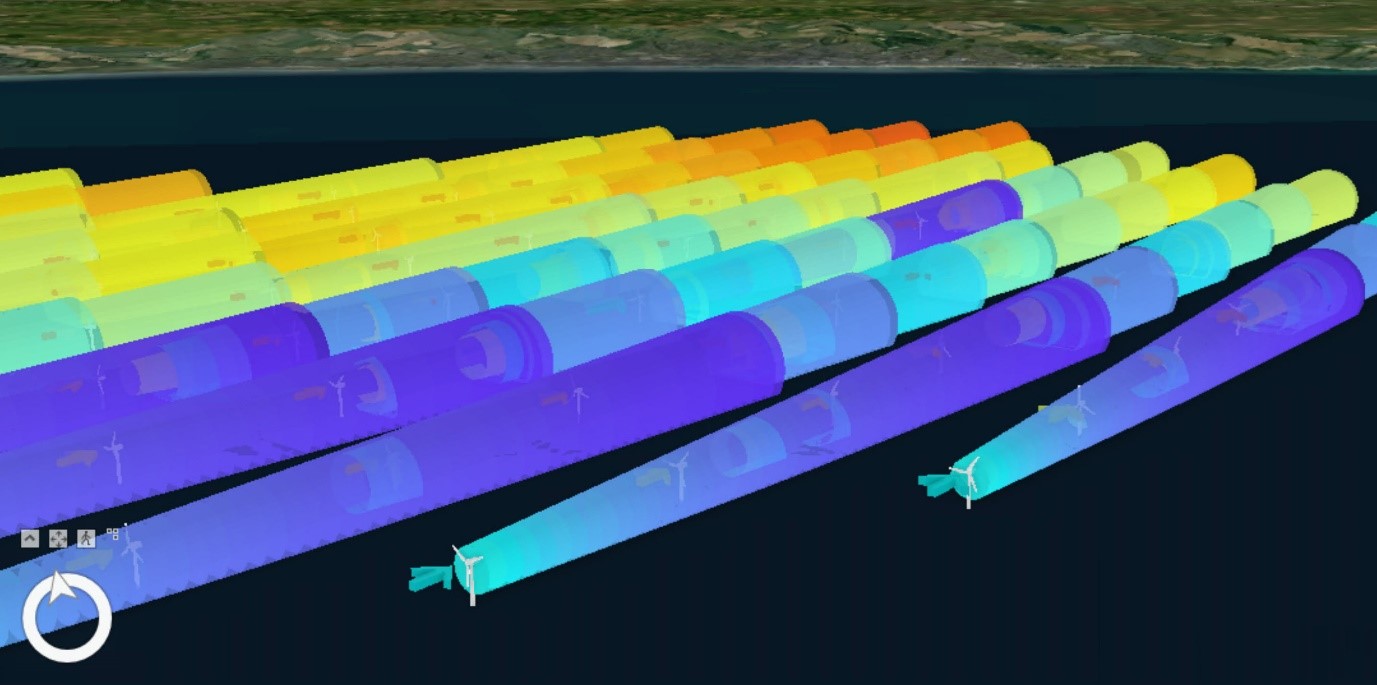
One of the nice features in ArcGIS Pro is its 3D visualisation capability. So, in addition to a regular 2D polygon layer, the toolkit produces a 3D multipatch layer for the wake models so that they can be visualised in a 3D Scene, along with a 3D arrow representing the wind speed at the turbine location – which as previously explained, takes into account the wakes produced by upwind turbines (see Figure 8).
Identifying the most efficient cable array
The challenge with connecting wind turbines together via a cable array is to find the most efficient network (usually the shortest in length), as each kilometre of cabling costs approximately £1M during the construction phase. There are also huge maintenance savings to be made over the life-span of a wind farm by minimising the amount of cabling to be maintained.
The ArcGIS Pro toolkit enables cable arrays linking groups of turbines to the wind farm substation to be developed and analysed very quickly. Both chain arrays (where turbines are connected to the substation through a series of branches) and loop arrays are supported.
While chain arrays typically require less cabling and are therefore cheaper to install, loop arrays provide greater protection against loss of revenue due to cable fault or damage during operation. Using the toolkit, the turbines in each group can be connected based on one of two algorithms:
- Prim – a Minimum Spanning Tree algorithm which connects the turbines into a chain measuring the shortest possible distance, often comprising multiple branches.
- 2-Opt – a local search algorithm for solving the classic ‘Traveling Salesman Problem’, where a given set of locations (the turbines) are required to be visited once via the shortest possible loop before returning to the starting location.
The Prim algorithm always finds the shortest route to connect turbines, meaning the output will be the same every time it is run against a set of turbines. The 2-Opt algorithm produces different results each time it is run as it contains an element of randomness – this is because the number of possible routes between turbines grows exponentially as the number of turbines increases, and it quickly becomes impractical to test every possible route. Running the 2-Opt algorithm multiple times produces different iterations whose total cable length varies, allowing the user to select the shortest (and so cheapest).
The output of the tool is a line layer showing the cable arrays symbolised either by the distance at any point along the array from the substation, or by turbine groups, depending on user preference. The layers also report the total distance of the connections created by the algorithm, so that outputs can easily be compared for efficiency and potential cost-saving purposes.
Rampion’s actual turbine connections are divided into 6 closed loops totalling 118.28 km in length (see Figure 9). The ArcGIS Pro toolkit 2-Opt algorithm (see Figure 10) was run against the same groups and the resulting loops totalled 114.28 km, representing a saving of approximately 4km of cable (a potential c. £4M construction cost-saving). Meanwhile, the ArcGIS Pro toolkit Prim algorithm (see Figure 11) generated chain arrays totalling 93.31 km of cables (a potential c. £25M construction cost-saving, although – as mentioned previously – chain arrays require less cabling but are prone to increased revenue loss through operational outages when compared to loop arrays).

Figure 9 – Rampion cable array symbolised by groups of looped turbines.

Figure 10 – Modelled 2-Opt cable array symbolised by distance from substation.

Figure 11 – Modelled Prim cable chain array symbolised by groups.
Conclusion
Initial results from our toolkit clearly demonstrate that ArcGIS Pro can be used to optimise offshore wind farm design through integrated analysis of sea-bed environment, wind characteristics and electrical cable layout.
The speed of the tools allow you to rapidly generate and analyse turbine patterns for potential power output and cable array efficiency, before fixing the turbine locations too early in the design process.
Integrated planning of this nature should enable wind farm operators of the future to achieve significant (in the millions of $) development & maintenance cost-savings, while maximising revenue from power generated through the lifespan of the project.
If you’re interested to find out more, please contact us.
Posted by Chris Jepps, Adrian Birch and Richard Webb.
