Dips and strikes?
Dip and strike readings are simple but important geological measurements which can be used for structural and stratigraphic analysis. They are generally made by a field geologist directly at a geological outcrop.
The dip of the geological layer is defined as the maximum inclination, in degrees, of the layer from the horizontal plane. Strike is defined as the compass bearing (or direction) of the line formed by the intersection of a geological layer (or other planar feature, such as a fault) with an imaginary horizontal plane. The dip direction is always perpendicular to the strike direction, but it is important to note the right hand rule, which states that the dip-direction must be located clockwise with respect to the azimuth chosen for strike.
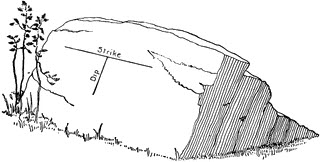
Figure 1. Dip and strike of an inclined strata, taken from Amadeus W. Grabau, Textbook of Geology (Boston: D.C. Heath & Co., 1920) 585.
Can you can plot them on a map?
The workflow in this blog is also available to watch as a video.
The field geologist (you, or one of your colleagues) arrives back from the field, having collected a lot of data, including dip-strike readings. These readings are most likely to consist of a GPS location along with a dip and strike, written down in a notebook. The first step for you is to convert these readings into a CSV table or Excel spread sheet, which can then be added into the GIS:
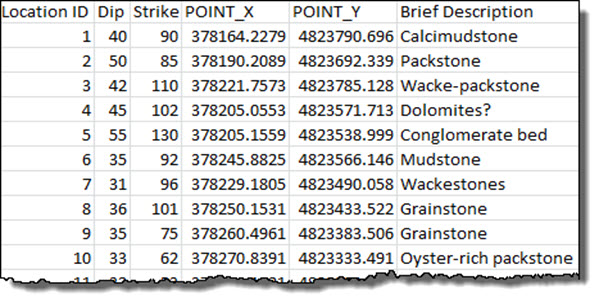
Figure 2. A spread sheet containing dip/strike data
If you’re using ArcMap, add this table to the map using the Add Data tools found in ArcMap 10. By navigating to File > Add Data > Add XY Data… define which column hosts the X, Y and Z coordinates and import the data as locations on the map.
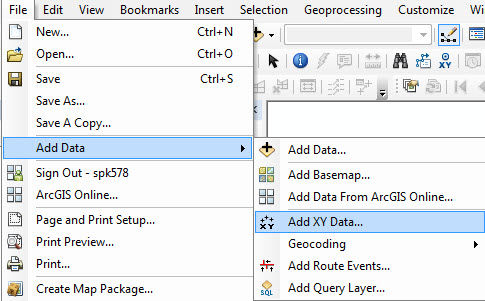
Figure 3. Navigate to “Add XY Data”
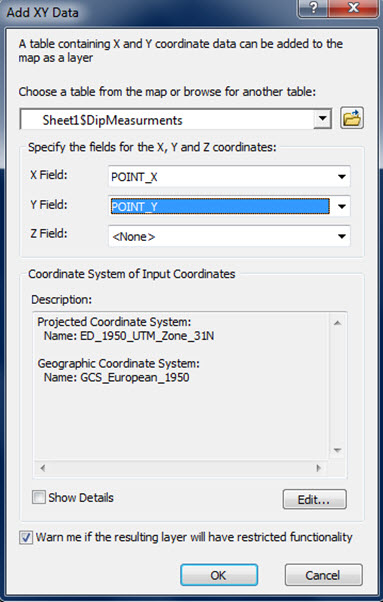
Figure 4. Choose the columns that include the X, Y coordinates of your data
The will convert the locations into points on the map, in the selected coordinate system, using a default symbology (figure 5). Note that the other attributes in the spread sheet are added to the attribute table within the map.
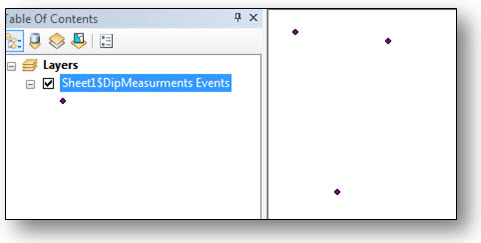
Figure 5. Default symbology applied to location data
It doesn’t look very geological to me
So, you now have your points on the map, but they’re not displayed correctly. In ArcMap there’s a standard set of geological symbols available within the Geology 24K style. A variety of symbols representing strike and dip are available, as shown in Figure 6.
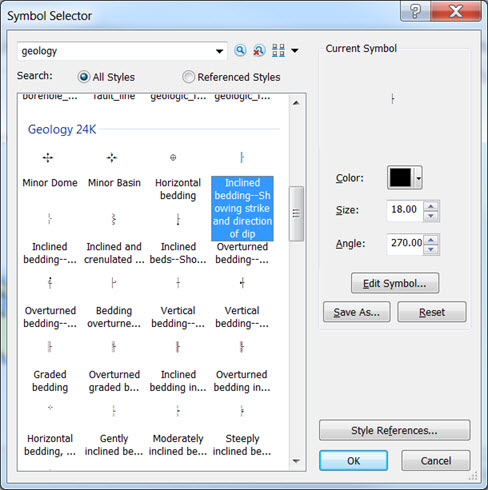
Figure 6. Some of the Geology 24K symbols
Simply selecting and applying one of the symbols does not magically make them rotate correctly – by default, you will end up with all the symbols rotated by the same angle. In order to make the symbols rotate to the correct bearing for each strike reading, select the Advanced > Rotation option within the Symbology tab of the Layer Properties dialog:
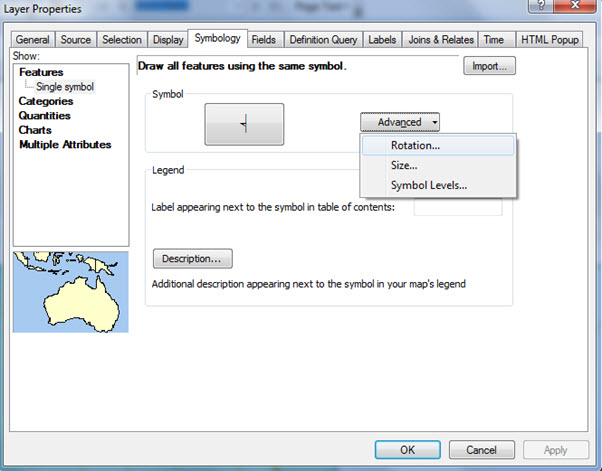
Figure 7. Accessing the symbol rotation dialog
Selecting the Rotation option will display the “Rotate” dialog which allows you to select an attribute field to use to define the angle of rotation. In my example, the attribute field is called “Strike” and, as the readings were taken as compass bearings, the rotation style you need to select is “Geographic”.
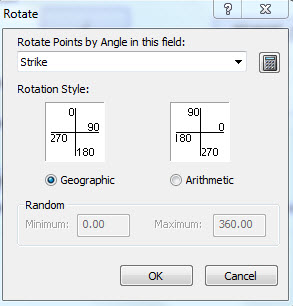
Figure 8. The symbol rotation dialog
But what about the dip?
Next, add a label to display the dip value and your dip/strike readings will be correctly displayed on the map:
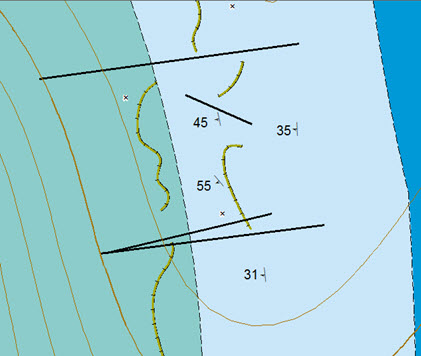
Figure 9. Correctly rotated dip-strike data points on a geological map.
![]() Watch this blog as a video: Plotting Dip and Strike Readings with ArcGIS
Watch this blog as a video: Plotting Dip and Strike Readings with ArcGIS
Posted by Simon Kettle, GIS Technician


