A lot of petroleum GIS conference presentations I’ve seen about play fairway mapping describe processes whereby the common risk segment layers are produced in raster format. I guess this is due being able to use Spatial Analyst and the Raster Calculator to ‘stack up’ layers with numeric attributes and perform mathematic calculations on them. That’s all well and good, but there are significant advantages to be had in keeping the analysis ouputs in vector format, and not turning everything into a grid.
1-0
First up we have data resolution and accuracy. If you derived your risk layer from proxies such as GDE maps or even hand drawn interpretation, then imposing a grid upon the data is going to reduce resolution and potentially introduce errors. Its the same principal as why a 2 megapixel camera probably takes ‘worse’ pictures than a camera using film. This can be seen faily clearly in the examples below – note that the western well is incorrectly located inside the lower scoring (orange) segment on the raster representation (left image), when it should sit outside of it (right image).

2-0
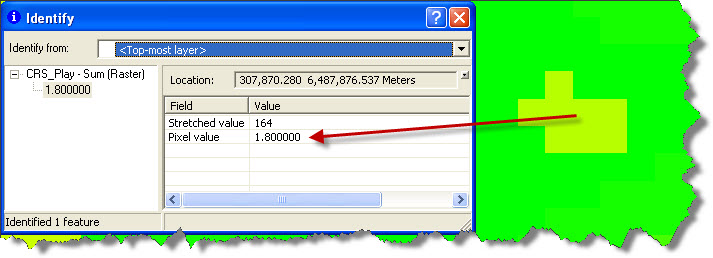
Secondly, keeping the analysis within the vector domain means it is possible to maintain an audit trail within the risk layers, using attribution. Consider the two example ‘Identify’ tool queries shown below. The first shows the results of an ‘Identify’ query performed on a raster format risk segment layer at a location of interest. We can see that the raster layer represents the common risk segment ‘sum’ value for the Jurassic Play, and that the location queried has a risk value of 1.8.

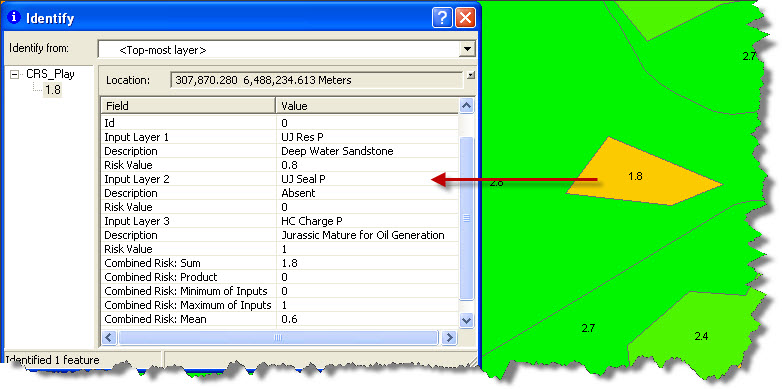
Compare this to the following query performed on a vector layer at the same location. We can see that this Upper Jurasic Play common risk segment layer has been derived from 3 component risk layers – Reservoir Presence, Seal Presence and Hydrocarbon Charge. In vector format the user can view each component risk value, as well as a number of ‘summary’ risk values (Sum, Product, Minimum, Maximum and Mean).

We can therefore see that the vector layer provides far more information to the user than the raster layer.
3-0
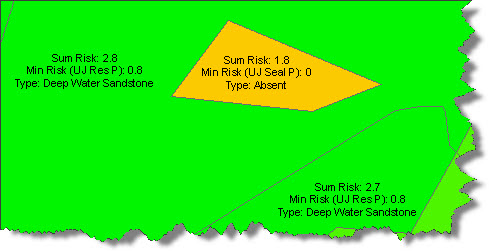
An extension of the attribution argument – keeping things in the vector domain allows you to label them. So, you can add simple labels based on one of the attributes, e.g. risk sum (as shown above), or you can add more complex labels that report, say, the final risk value and the highest risked element and its risk value, to help illustrate why a particular segment is risked as it is. So for our segment of interest, the user can see immediately that the risk sum value is 1.8, and that the segment scores lower than its neighbours for overall risk because the highest risked factor (Seal Presence) has scored 0, due to the seal being interpreted as being absent.

3-1
That’s why Exprodat’s Exploration Analyst software uses the vector domain for most analyses. I say ‘most’, the user is able to optionally produce raster outputs in the final phase, when the combined common risk segments are created, as these can be useful for calculating zonal statistics. Hey, we’re not anti-raster here you know!
Posted by Chris Jepps, Technical Director, Exprodat.


