As geoscientists, we need to bring into ArcGIS various types of gridded data, including surfaces with elevation values, sub-surface horizons with depth values, or imagery with spectral values.
If you don’t have access to a dedicated ArcGIS extension for loading such data types, like our own Data Assistant, then the way to load these into ArcGIS is often determined by the method of export from the various E&P software packages, such as those designed for sub-surface data e.g. Petrel.
One of the common export options is delimited XYZ format. The XYZ format contains X-Y values for surface or sub-surface location, and a corresponding Z value representing elevation or depth. Usually the X-Y points are regularly spaced in a grid.
The XYZ file will usually be in text file format and this can be imported and displayed in ArcGIS as follows:
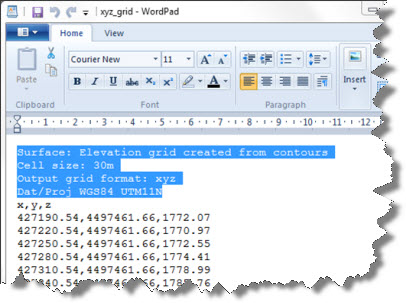
Open the file in a text reader such as Wordpad. If you don’t already know the datum and projection, this can be found in the file header as highlighted below. Make sure you take a note of the grid cell size.

ArcGIS doesn’t read XYZ headers as it takes the information from the x,y,z columns, so strip the header by removing the four highlighted lines and save it as a new text file. Be careful not to remove the x,y,z line which is the instruction to read in the columns, in this format.
The new file can be added as a table to an ArcGIS mxd, then displayed by selecting the Display XY Data option (for details on how to do this, see our previous Training Tip on Tabular XY Data).
Remember to set the coordinate reference system according to the header information. This should also be the same as the data frame for the mxd project.
Bringing in XY data only results in a temporary ‘events’ layer so to make this permanent, export the data to a new feature class in a geodatabase.
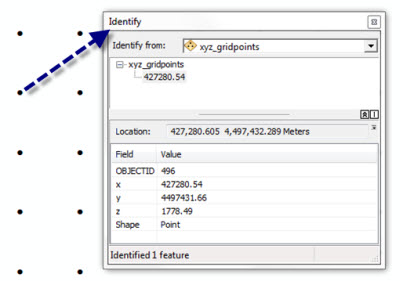
What we have now is a feature class representing the grid of data points with their z values.

To display the points as a surface, use the Point to Raster tool from ArcToolbox, selecting z as the Value Field and enter the Cellsize from the information in the original header. Note that the points are assumed to be the centroid of the raster cell – ideally you should double-check that this tallies with how the points were exported otherwise you may erroneously introduce a positional shift.
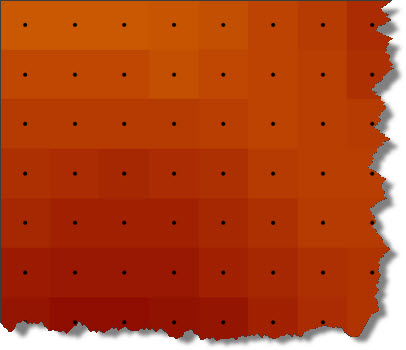
The following graphics show the zoomed in view of the raster surface with the original grid points overlaid, and a full view of the raster surface (DEM).


This is only one type of grid format that can be imported from E&P software and displayed in ArcGIS. Other types include image processing formats .img and .ers; and ASCII GRID.
In closing, remember it is also possible to export data from a raster grid in ArcGIS to a table containing the x,y,z values of the centre points of the cells. For this, have a look at our previous blog post on Converting Rasters to XYZ ASCII Files.
For further information on using grids and surface data in ArcGIS, see Exprodat’s course ArcGIS 3D Surface Analysis for Petroleum, or take a look at our software.
Posted by Mike Phillips, Senior GIS Consultant


