
The focus on web mapping application is back, or maybe it never really went away. As we use browser-based mapping technologies more and more I think it is time to discuss what, in my experience, has been important in web-based map creation.
In this blog I suggest some things to consider when publishing from a Map Document (MXD) to a Map Service that can be consumed by a web mapping application such as Portal for ArcGIS.
Here is my check list of the things to consider when pushing out a web map:
- Purpose
- Keep it Simple!
- Designing the map to meet the purpose, with respect to:
- Querying data
- Symbology
- Labelling

Purpose
Map design is heavily dependent on purpose and adding value to your organisation. Part of a GIS specialist’s role is to find out what that should be. Discuss with users and teams to gather the maps purpose.
This could range from a simple basemap that is updated regularly, interrogation of data, particular workflows or viewing specific vendor data that is frequently used by that team or person.
Keep it simple!
Hone the map content for the map’s purpose and remove clutter from the map as much as possible. What data is actually required to meet the map’s purpose? And bear in mind that map design can influence how a user interprets a map.
Designing the map to meet the purpose
Querying data
One of the key functions of a web map is to query data. All of the below steps are intended for adjustment within ArcMap before sharing to a Map Service.
i. Does the layer describe the data and its provenance? (e.g. the naming of the layer) Note: OGA is the new Oil and Gas Authority in the UK replacing DECC.

ii. Should the layer be constrained to a scale? GIS maps commonly contain data designed to be viewed at a range of scales. For example a map may contain regional scale annotation (designed to be viewed at 1:3,000,000) that is not appropriate to be displayed at 1:50,000.
Within ArcMap we can use scale dependencies, to enable data to be visible at particular scales. This capability allows a variety of data to be used at a range of scales, allowing that map to be flexible in fulfilling its purpose.
iii. Only turn required attributes on (is a field required for the map purpose?) Layer Properties > Fields
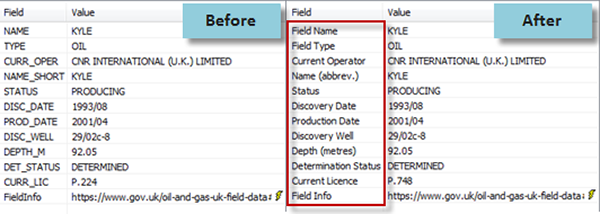
iv. Use field aliases to help the users experience (for example the field should clearly state the unit and contain a proper full-word description e.g. “Elevation (m)” vs. “ELV_M_ED50”)
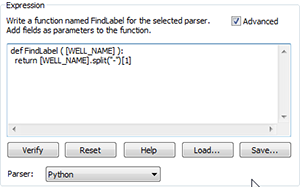
v. Use expressions in Layer Properties > Display to influence what the user sees when interrogating a feature (e.g. well name 29/3b-9 vs “9”). In this example does the well name really require its quad and block information?
vi. Definition queries should be used to display only relevant data within a dataset. If the map purpose only requires Offshore UK Blocks then why show Onshore Blocks? Additionally, using Definition queries will also improve map service performance.
Symbology
Keeping the map simple and purpose driven will make it immediately easier to manage symbology, because there will be fewer items to symbolise and a strong direction related to what message is being conveyed by the map.
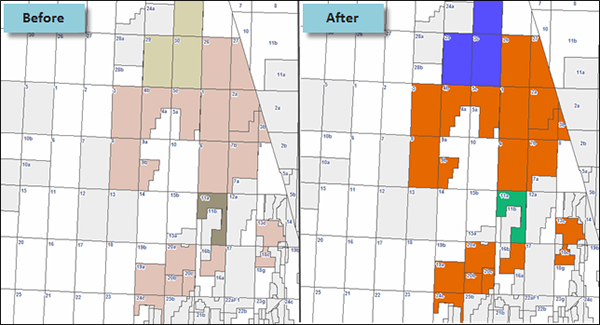
1. Colour is a principal cartographic consideration and something that has generated deep discussion, see Colour Theory. Using colours incorrectly can result in the incorrect interpretation of the data. Bolder more saturated colours draw attention to a feature, in particular when set against an unsaturated background. I suggest starting with ColourBrewer to design an appropriate colour scheme for your map. The image below shows blocks that were awarded in the UK’s 28th Round. The choice of colours draws the user towards the blocks in question:
2. Scale dependency – Symbols for point data like wells or facilities can overcrowd the map. Consider using appropriate scale dependencies to either only show the data dense layer at an appropriate scale or use definition queries to only show data that is really required, for example indicate wells of a certain status only
It is worth noting Esri’s recently released Smart Mapping capability, which uses cartographic principals to create ‘smart’ defaults in order to generate attractive and clear maps.
Labelling
Again, think about the map purpose and only label what is needed. Labelling is probably one of the most influential components of map performance, so use expressions to show only what is needed to meet the map’s purpose.
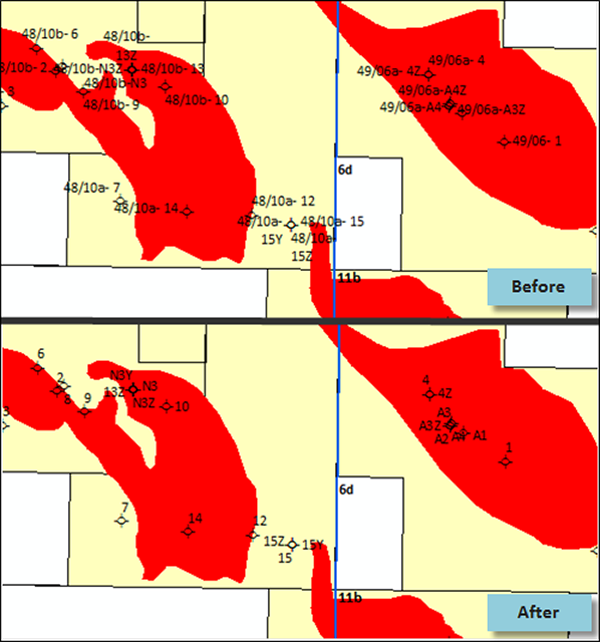
The below example presents exploration wells in the Southern North Sea using well data from the OGA. The map already has contextual data (i.e. quadrants and blocks) so why include the quadrant and block numbers in the well labelling too? Using the expression above, from the display tab settings, to adjust the labels creates a cleaner, less cluttered map.
Summary
A web map should be purpose driven and meet that purpose in the simplest and clearest way possible.
If you need any help with map design and its technicalities, or how to go about analysing users’ needs to develop useful informative maps, then please do drop us a line!
Simon Kettle, Senior GIS Consultant, Exprodat.


